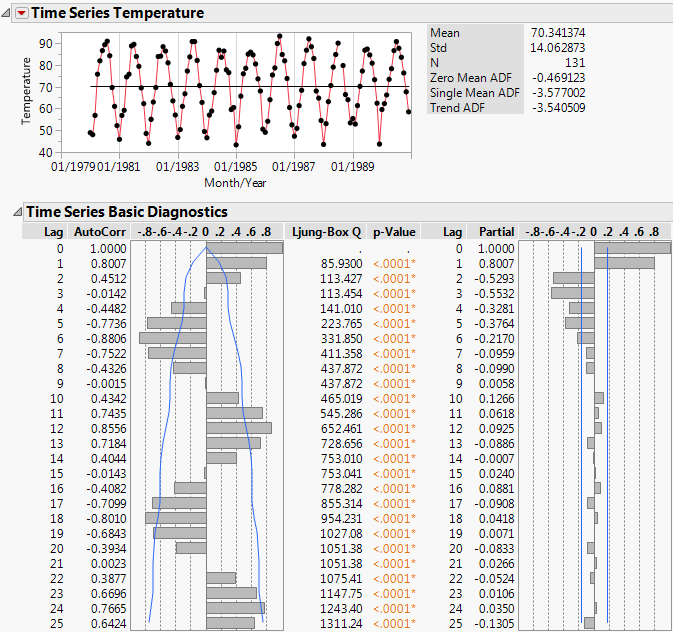
This example uses the Raleigh Temps.jmp sample data table, which contains maximum monthly temperatures measured in degrees Fahrenheit from 1980 to 1990. Use the Time Series platform to examine the series and predict the maximum monthly temperatures for the next two years.
|
1.
|
|
2.
|
Select Analyze > Specialized Modeling > Time Series.
|
|
3.
|
|
4.
|
|
5.
|
In the box next to Forecast Periods, type 24.
|
|
6.
|
Click OK.
|
Time Series Analysis Report for Raleigh Temps.jmp
|
8.
|
Set p, the autoregressive order, to 1 because the series showed evidence of autocorrelation.
|
|
9.
|
Click Estimate.
|
|
10.
|
Click the Time Series red triangle and select Seasonal ARIMA.
|
|
11.
|
In the ARIMA box, set p, the autoregressive order, to 1 because the series showed evidence of autocorrelation.
|
|
12.
|
In the Seasonal ARIMA box, set D, the seasonal differencing order, to 1 because the series showed evidence of seasonality.
|
|
13.
|
Click Estimate.
|
|
14.
|
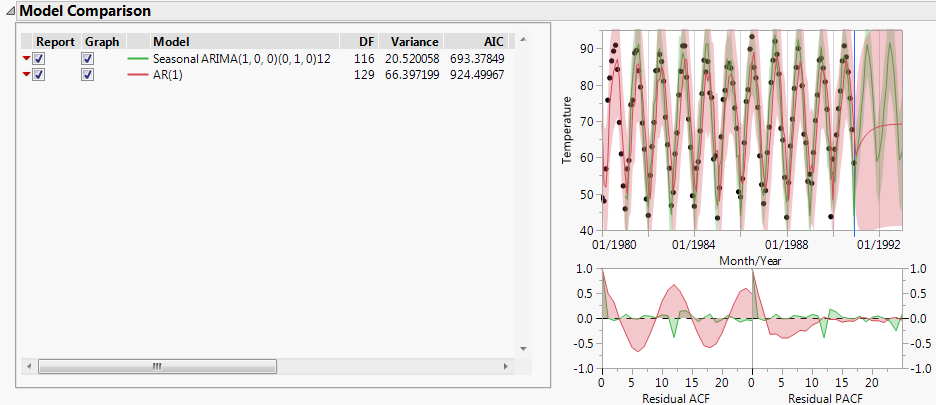
In the Model Comparison table, check the box under Graph for both models.
|
Model Comparison Table for Raleigh Temps.jmp