|
1.
|
|
2.
|
Select Graph > Chart.
|
|
3.
|
|
4.
|
Click OK.
|
The bar chart in Example of a Chart with one Category and no Statistics shows a bar for each level of the Size Co variable.
|
1.
|
|
2.
|
Select Graph > Chart.
|
|
3.
|
|
4.
|
|
5.
|
Click OK.
|
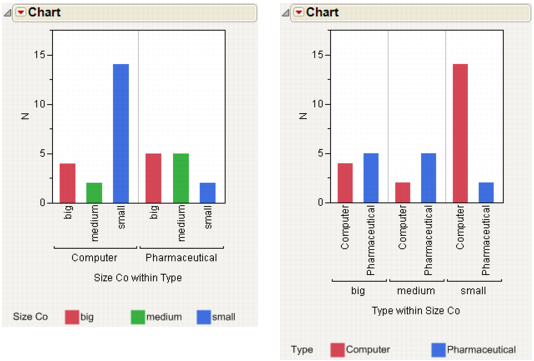
The bar chart on the left in Examples of Charts with Two Categories and No Statistics shows the levels for the size of computer companies and of pharmaceutical companies. The bar chart on the right shows the results if you first selected Size Co and then Type as category variables.