|
1.
|
|
2.
|
Select Graph > Chart.
|
|
3.
|
|
4.
|
|
5.
|
|
6.
|
Select Mean from the menu of statistics.
|
|
7.
|
Click OK.
|
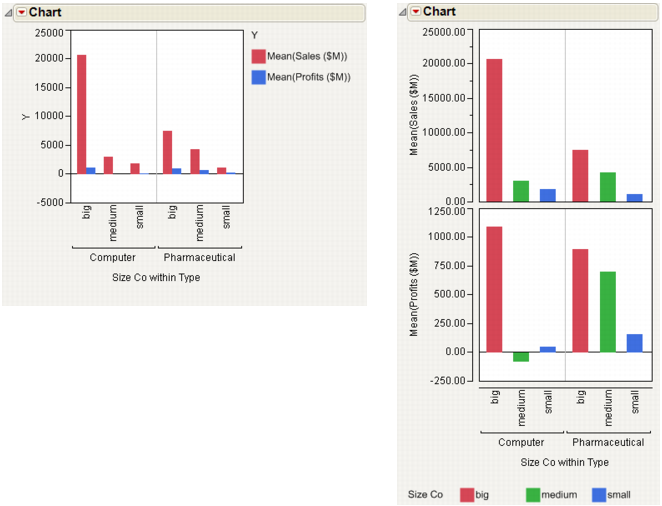
The chart on the left in Examples of Charts with Two Statistics and Two Categories shows the result.
|
8.
|
To see a separate chart for each statistic, click to deselect Overlay from the red triangle menu for Chart.
|
The chart on the right in Examples of Charts with Two Statistics and Two Categories shows the result.