In the Save Script menu, To Data Table (All Objects) and To Script Window (All Objects) save a script for all levels of the By variable.
To turn on Automatic Recalc for a report window, click on the platform red triangle menu and select Redo > Automatic Recalc. To turn it off, deselect the same option. You can also turn on Automatic Recalc using JSL.
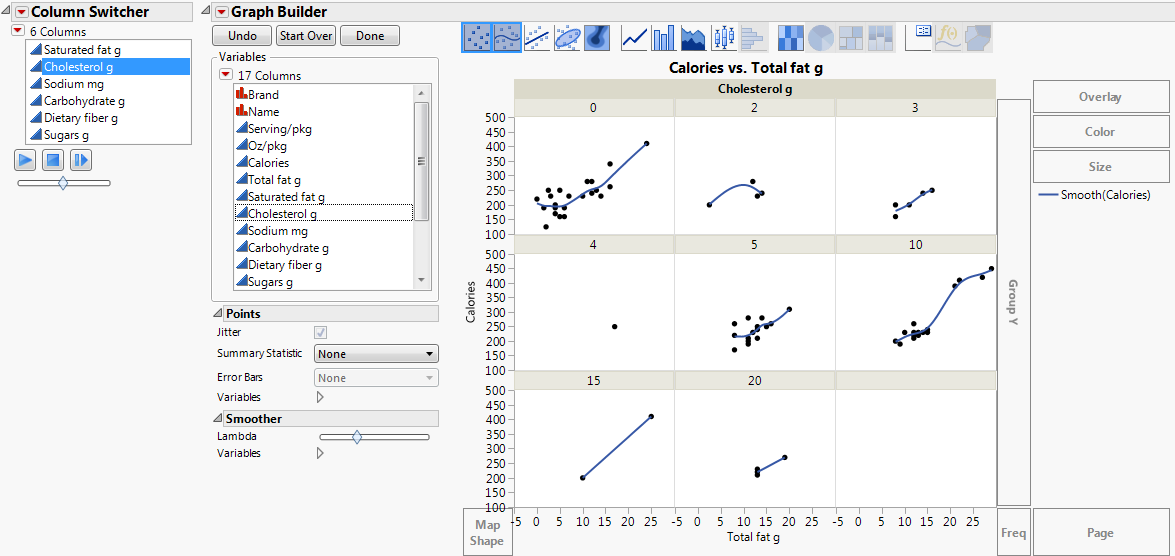
Within a report, use the Column Switcher to quickly analyze different variables without having to re-create your analysis. To activate the Column Switcher, from a report window, click on the red triangle menu. Select Redo > Column Switcher.
|
1.
|
|
2.
|
Select Graph > Graph Builder.
|
|
3.
|
|
4.
|
|
5.
|
|
6.
|
From the red triangle next to Graph Builder, select Redo > Column Switcher.
|
|
7.
|
|
8.
|
Select Saturated fat g, Cholesterol g, Sodium mg, Carbohydrate g, Dietary fiber g, and Sugars g and click OK.
|
|
9.
|
Click the Play button to cycle between the different factors. Use the slider to control the speed of the animation. Alternatively, you can step through each factor individually.
|
You can see that the relationship between calories and fat is relatively strong for each level of carbohydrate. Therefore, Carbohydrate g appears to be the best predictor of calorie levels.