A scatterplot matrix helps you visualize the correlations between each pair of response variables. The scatterplot matrix is shown by default, and can be hidden or shown by selecting Scatterplot Matrix from the red triangle menu for Multivariate.
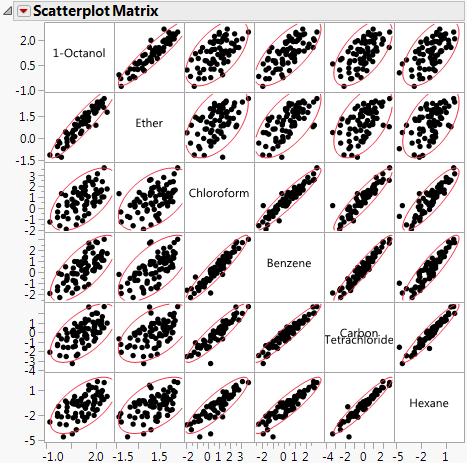
When you look for patterns in the scatterplot matrix, you can see the variables cluster into groups based on their correlations. Scatterplot Matrix shows two clusters of correlations: the first two variables (top, left), and the next four (bottom, right).
|
Shows or hides the 95% density ellipses in the scatterplots. Use the Ellipse α menu to change the α-level.
|
|
|
Colors each ellipse. Use the Ellipses Transparency and Ellipse Color menus to change the transparency and color.
|
|
|
Shows either horizontal or vertical histograms in the label cells. Once histograms have been added, select Show Counts to label each bar of the histogram with its count. Select Horizontal or Vertical to either change the orientation of the histograms or remove the histograms.
|
|
|
Ellipse α
|
Sets the α-level used for the ellipses. Select one of the standard α-levels in the menu, or select Other to enter a different one.
|
|
Sets the transparency of the ellipses if they are colored. Select one of the default levels, or select Other to enter a different one. The default value is 0.2.
|
|
|
Sets the color of the ellipses if they are colored. Select one of the colors in the palette, or select Other to use another color. The default value is red.
|
|