Using the Show Roles option in the red triangle menu, you can make changes to your existing variables without having to relaunch the platform and start your analysis over.
Follow the instructions in Example of a Dynamic Bubble Plot to produce the report window shown in Example of Bubble Plot with Show Roles Selected. (The colors are the JMP default colors.)
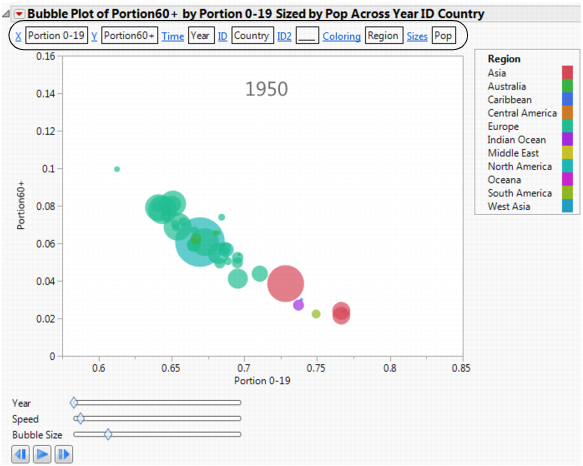
To change the variable assigned to a role, click on a blue underlined role name. For example, in Example of Bubble Plot with Show Roles Selected, to change the Coloring variable from Region to Country, proceed as follows:
|
1.
|
Click on the Coloring link.
|
|
2.
|
Click on Country.
|
|
3.
|
Click OK.
|
To remove an existing variable from the bubble plot, make sure that nothing is selected in the Select column for <Role> window, and click OK. For example, in Example of Bubble Plot with Show Roles Selected, to remove the Sizes variable (Pop), proceed as follows:
|
3.
|
Click OK.
|
|
•
|
In the data table, click on the variable in the column panel, and drag it into the empty role box.
|