 Spatial Example: Uniformity Trial
Consider the Uniformity Trial.jmp sample data table. An agronomic uniformity trial was conducted on an 8x8 grid of plots. In a uniformity trial, a test crop is grown on a field with no experimental treatments applied. The response variable, often yield, is measured. The idea is to characterize variability in the field as background for planning a designed experiment to be conducted on that field. (See Littell et al., 2006, pp. 447.)
Once you have established whether there is a nugget effect, you determine the best fitting spatial covariance structure. Finally, you fit the blocking models and compare these to the best spatial structure. In this example, both AICc and BIC are used to select a best model. Spatial Correlation Structure provides more information about nugget effects and other spatial terminology.
 Fit a Spatial Structure Model
To determine whether there is significant spatial variability, you can fit a model that accounts for spatial variability. Then you can compare the likelihood for this spatial model to the likelihood for a model that does not account for spatial variability. You can do this because the independent errors model is nested within the spatial model family: The independent errors model is a spatial model with spatial correlation, ρ, equal to 0. This means that you can perform a formal likelihood ratio test of the two models.
|
1.
|
|
2.
|
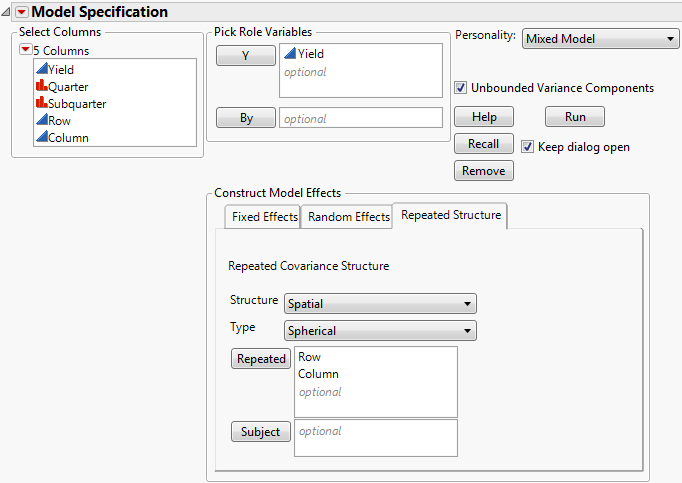
Select Analyze > Fit Model.
|
|
3.
|
Select Keep dialog open so that you can return to the launch window in the next example.
|
|
4.
|
|
5.
|
Select Mixed Model from the Personality list.
|
|
6.
|
Select the Repeated Structure tab.
|
|
7.
|
Choose Spatial from the list next to Structure.
|
|
8.
|
Choose Spherical from the list next to Type.
|
|
9.
|
|
10.
|
Click Run.
|
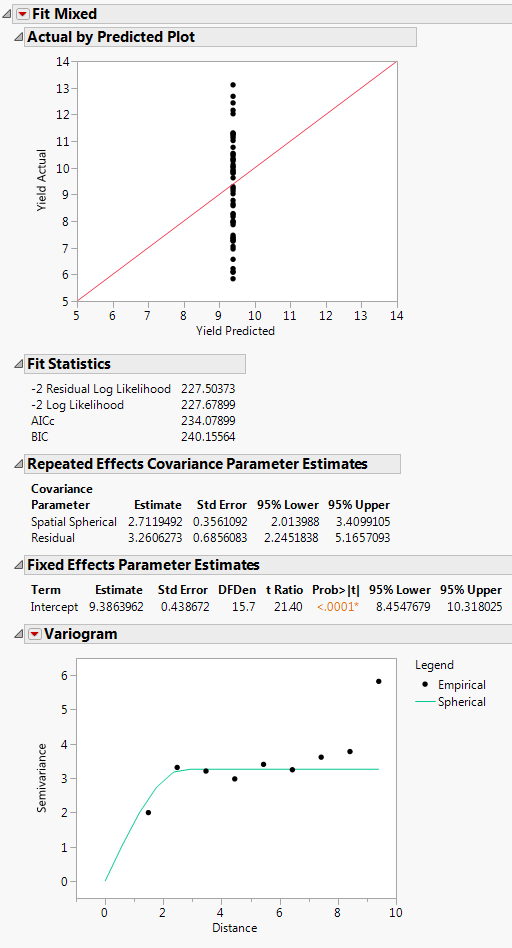
The Fit Mixed report is shown in Fit Mixed Report - Spatial Spherical. The Actual by Predicted Plot shows that the predicted yield is a single value. This is because only spatial covariance was fit. The Fit Statistics report shows that -2 Log Likelihood is 227.68, and the AICc is 234.08.
Because an isotropic spatial structure was fit, a Variogram plot is shown. Because the trials are laid out in an 8 by 8 grid, there are more pairs of points at small distances than at very large distances. See Graph Builder Plot of Proposed Complete and Incomplete Block Designs for the layout. The Variogram shows that a spherical spatial structure is an excellent fit for distances up to about 8.4. The distance class for the final distance consists of only the two diagonal pairs of points.
The Repeated Effects Covariance Parameter Estimates report gives estimates of the range (Spatial Spherical = 2.71) and the sill (Residual = 3.26). See Variogram.
 Fit the Independent Errors Model
|
2.
|
Select Repeated Structure tab.
|
|
3.
|
Select Residual from the Structure list.
|
|
4.
|
|
5.
|
Click Run.
|
 Conduct a Likelihood Ratio Test (Optional)
You can conduct a likelihood ratio test in this example, because the independent errors model is nested within the spatial model family. The independent errors model is a spatial model with spatial correlation, ρ, equal to 0. This means that you can perform a formal likelihood ratio test of the two models.
In this example, the likelihood ratio test statistic is 254.22-227.68=26.54. Comparing this to a Chi-square distribution on one degree of freedom, the null hypothesis of no spatial correlation is rejected with a p-value < 0.0001. You can conclude that these data contain significant spatial variability.
 Select the Type of Spatial Covariance
|
2.
|
Select the Repeated Structure tab.
|
|
3.
|
|
4.
|
Select Spatial with Nugget from the Structure list.
|
|
5.
|
Select Spherical from the Type list.
|
|
6.
|
Click Run.
|
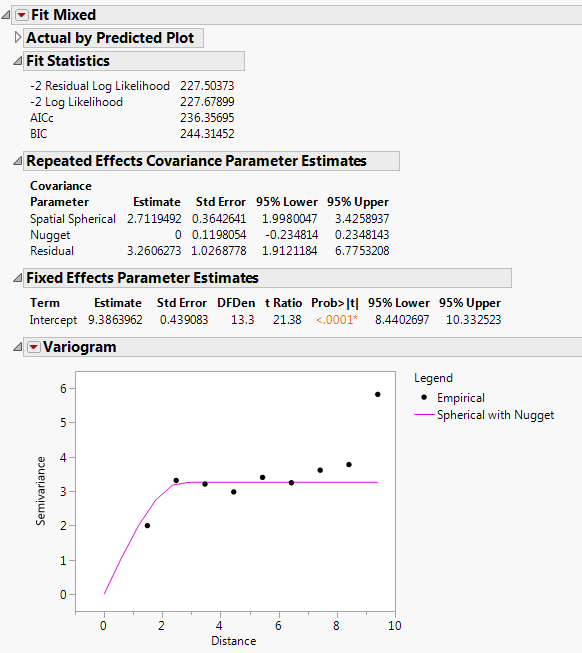
The Fit Mixed report is shown in Fit Mixed Report - Spatial Spherical with Nugget. Notice that the log-likelihoods are essentially equal to those of the spherical with no nugget model, and the AICc is slightly higher (236.36 compared to 234.08). The Repeated Effects Covariance Parameter Estimates report shows that the Nugget covariance parameter has an estimate of zero. There does not appear to be any evidence for a nugget effect.
|
7.
|
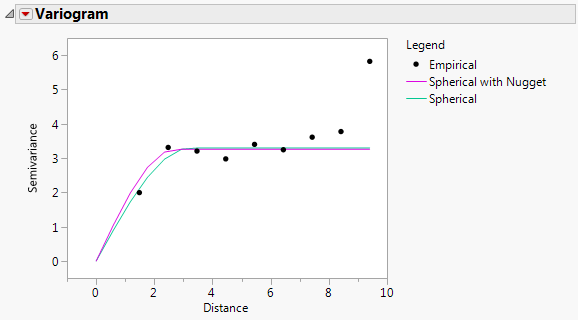
From the red triangle menu next to Variogram, select Spatial > Spherical.
|
|
9.
|
Select Repeated Structure tab.
|
|
10.
|
To test anisotropicity, select Spatial Anisotropic from the Structure list.
|
|
11.
|
Select Spherical from the Type list.
|
|
12.
|
Click Run.
|
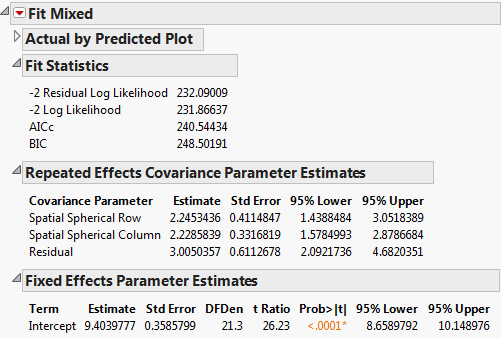
The Fit Mixed report is shown in Fit Mixed Report - Spatial Anisotropic Spherical. The fit statistics indicate not as good a fit as the isotropic (spatial structure) spherical model (AICc 240.54 compared to 234.08). The Repeated Effects Covariance Parameter Estimates report shows that the estimates for the Row (Spatial Spherical Row) and Column (Spatial Spherical Column) covariances are very close. There is no evidence to suggest that spatial correlations within rows and columns of the grid differ.
 Determine the Type of the Spatial Structure
|
2.
|
Select the Repeated Structure tab.
|
|
3.
|
|
4.
|
Select Spatial from the Structure list.
|
|
5.
|
Select Power from the Type list.
|
|
6.
|
Click Run.
|
|
8.
|
Select Exponential from the Type list.
|
|
9.
|
Click Run.
|
|
11.
|
Select Gaussian from the Type list.
|
|
12.
|
Click Run.
|
The observed AICc values for these types and the other fits that you performed are summarized in Fit Statistics for Spatial Models Fit.
 Compare the Model to Block Designs
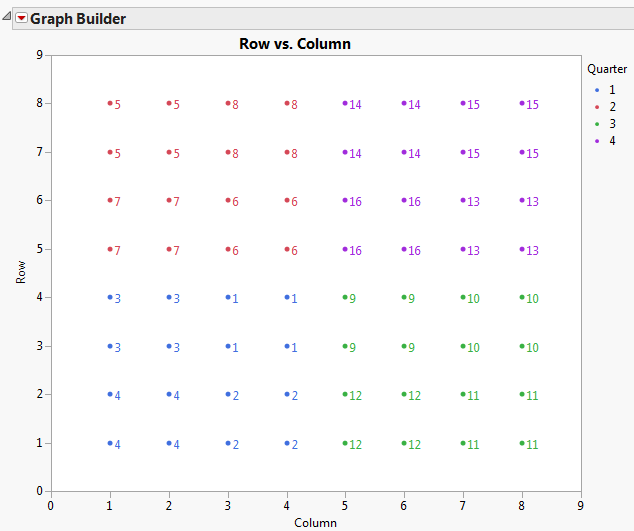
|
2.
|
Select Repeated Structure tab.
|
|
3.
|
Select Residual from the Structure list.
|
|
4.
|
|
5.
|
Select the Random Effects tab.
|
|
6.
|
|
7.
|
Click Run.
|
|
2.
|
Select the Random Effects tab.
|
|
3.
|
|
4.
|
|
5.
|
Click Run.
|