All of the Response Screening plots involve p-values for tests conducted using the FDR technique described in Benjamini and Hochberg, 1995. See also Westfall et al. (2011). This method assumes that the p-values are independent and uniformly distributed.
|
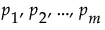
1.
|
 .
.|
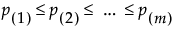
2.
|
 .
.|
3.
|
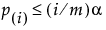 . Suppose this first
  .
.|
4.
|
 .
. , are computed as:
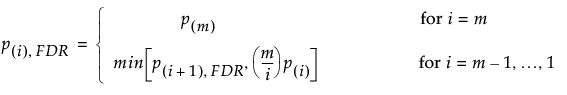
If a hypothesis has an FDR-adjusted p-value that falls below α, then it is rejected by the procedure.