The Repeated Measures Degradation and Destructive Degradation methods show a report that fits a default model. As shown in the Model Specification outline in Initial Repeated Measures Degradation Report with Transformation Outlines Open, this model fits each unit with its own intercept and slope, using a linear transformation of the response and time columns. Separate intercepts and slopes are fit for each value of the Label, System ID variable, or, if only an X variable is specified, separate intercepts and slopes are fit for each level of the X variable. The Stability Test method fits three models.
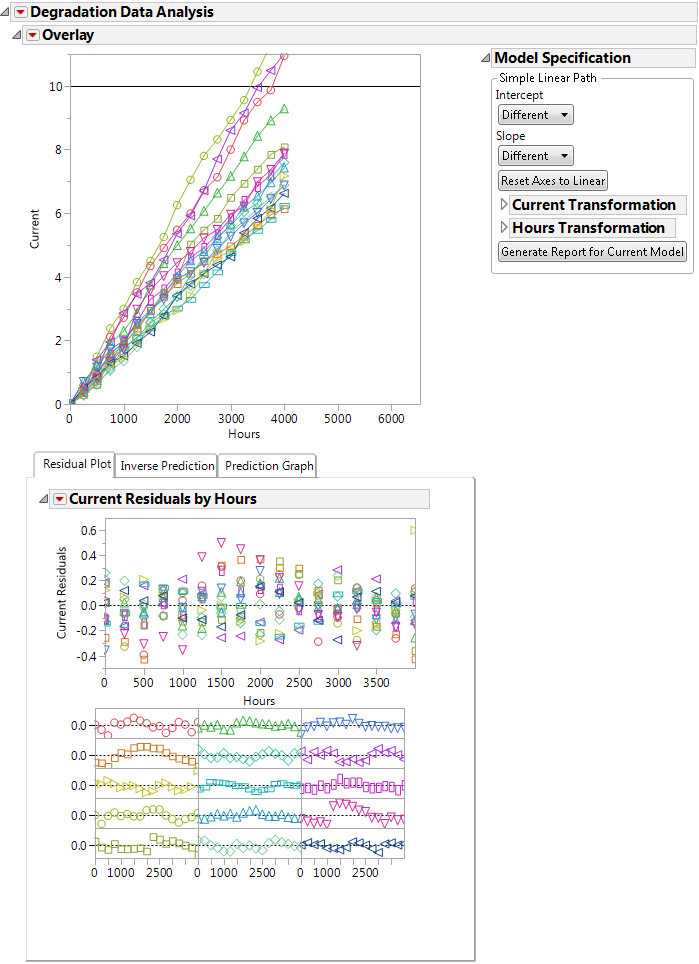
An Overlay plot of the Y, Response variable versus the Time variable. In this example, the plot is of Current versus Hours. The Overlay plot red triangle menu has the Save Estimates option, which creates a new data table containing the estimated slopes and intercepts for all units.
Specify your model and generate a report for that model. See Model Specification. (Available only for the Repeated Measures Degradation and Destructive Degradation methods.)
Compare models and estimate expiration dates. See Stability Analysis. (Available only for the Stability Test method.)
Shows analysis results for three different models and the best model. See Stability Analysis. (Available for the Stability Test method by default. Also available for the Repeated Measures Degradation and Destructive Degradation methods after you click Generate Report for Current Model.)