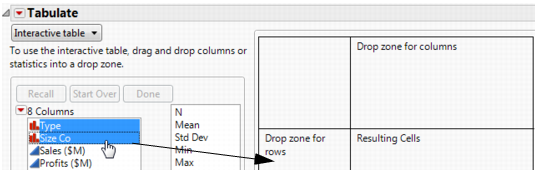
Create summary tables by using either the Summary or Tabulate commands. The Summary command creates a new data table. As with any data table, you can perform analyses and create graphs from the summary table. The Tabulate command creates a report window with a table of summary data. You can also create a table from the Tabulate report.
|
1.
|
|
2.
|
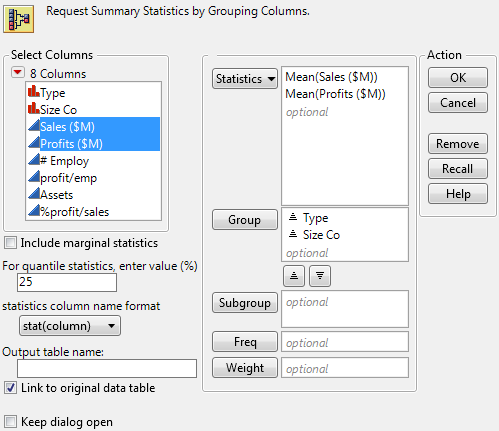
Select Tables > Summary.
|
|
3.
|
|
4.
|
|
5.
|
Click OK.
|
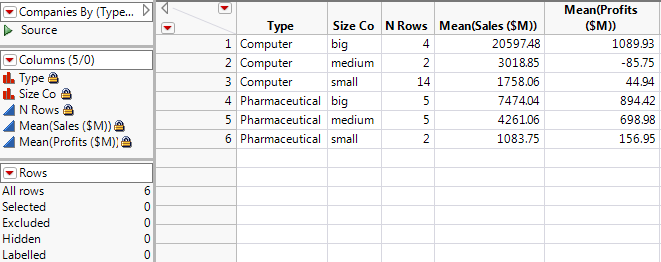
JMP calculates the mean of Sales ($M) and the mean of Profit ($M) for each combination of Type and Size Co.
|
•
|
|
•
|
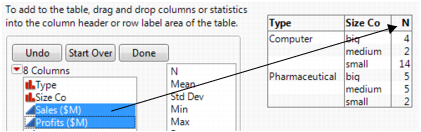
The N Rows column shows the number of rows from the original table that correspond to each combination of grouping variables. For example, the original data table contains 14 rows corresponding to small computer companies.
|
|
•
|
There is a column for each summary statistic requested. In this example, there is a column for the mean of Sales ($M) and a column for the mean of Profits ($M).
|
|
1.
|
|
2.
|
|
3.
|
|
4.
|
Drag and drop them into the Drop zone for rows.
|
|
5.
|
Right-click a heading and select Nest Grouping Columns.
|
|
6.
|
|
7.
|
The final step is to change the sums to means. Right-click Sum (either of them) and select Statistics > Mean.
|