Using the k-Sample Means option, you can compare up to 10 means. Consider a situation where 4 levels of means are expected to be in the range of 10 to 13, the standard deviation is 0.9, and your sample size is 16.
|
1.
|
Select DOE > Design Diagnostics > Sample Size and Power.
|
|
2.
|
Click the k Sample Means button in the Sample Size and Power Window.
|
|
3.
|
Leave Alpha as 0.05.
|
|
4.
|
Enter 0.9 for Std Dev.
|
|
5.
|
Leave Extra Parameters as 0.
|
|
7.
|
Enter 16 for Sample Size.
|
|
8.
|
Leave Power blank.
|
|
9.
|
Click Continue.
|
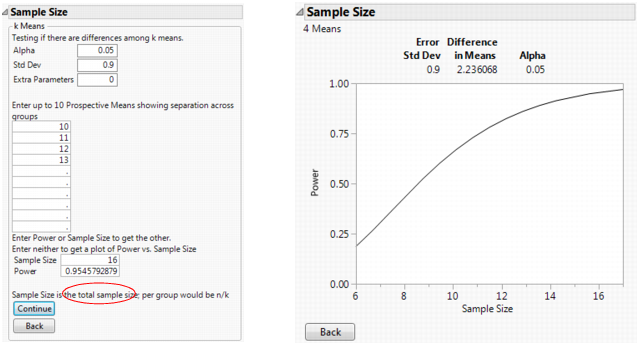
The Power is calculated as 0.95. (See the left of Prospective Power for k-Means and Plot of Power by Sample Size.) This means that there is a 95% chance of detecting that at least one of the means is different when the significance level is 0.05, the population means are 10, 11, 12, and 13, and the total sample size is 16.
If both Sample Size and Power are left blank for this example, the sample size and power calculations produce the Power versus Sample Size curve. (See the right of Prospective Power for k-Means and Plot of Power by Sample Size.) This confirms that a sample size of 16 looks acceptable.
Notice that the difference in means is 2.236, calculated as square root of the sum of squared deviations from the grand mean. In this case it is the square root of (–1.5)2+ (–0.5)2+(0.5)2+(1.5)2, which is the square root of 5.