Table 1.2 shows the data from a study that investigated a new blood pressure medication. Each individual’s blood pressure was measured over a six-month period. Two doses (300mg and 450mg) of the medication were used, along with a control and placebo group. The data shows the average blood pressure for each group.
|
1.
|
Select File > New > Data Table to create an empty data table.
|
|
2.
|
Note: To rename a column, you can also double-click the column name or select the column and press Enter.
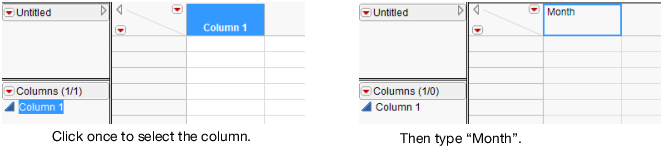
Figure 1.13 Entering a Column Name
|
3.
|
Select Rows > Add Rows.
|
|
5.
|
Click OK. Six empty rows are added to the data table.
|
|
6.
|
Enter the Month information by clicking in a cell and typing.
|
Figure 1.14 Month Column Completed
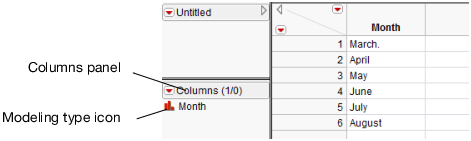
In the columns panel, look at the modeling type icon to the left of the column name. It has changed to reflect that Month is now nominal (previously it was continuous). Compare the modeling type shown for Column 1 in Figure 1.13 and for Month in Figure 1.14. This difference is important and is discussed in View or Change Column Information.
|
7.
|
|
8.
|
Change the name to Control.
|
|
9.
|
|
10.
|
Continue adding columns and entering data as shown in Table 1.2 to create the final data table with six rows and five columns.
|
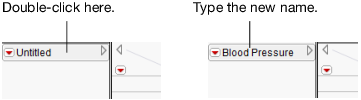
Figure 1.15 Changing the Data Table Name