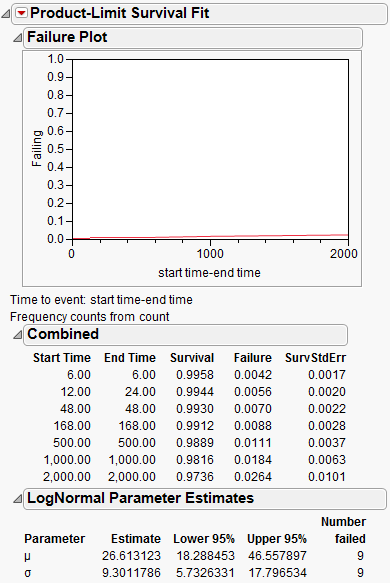
In this example from Nelson (1990, p. 147), microprocessor units are tested and inspected at various times and the failed units are counted. Missing values in one of the columns indicate that you do not know the lower or upper limit, and therefore the event is left or right censored, respectively.
|
1.
|
|
2.
|
Select Analyze > Reliability and Survival > Survival.
|
|
3.
|
|
4.
|
|
5.
|
Select the check box next to Plot Failure instead of Survival.
|
|
6.
|
Click OK.
|
|
7.
|
From the red triangle menu, select LogNormal Fit.
|
Figure 12.14 Interval Censoring Output