
|
1.
|
|
2.
|
Select Analyze > Predictive Modeling > Partition.
|
|
3.
|
|
4.
|
|
–
|
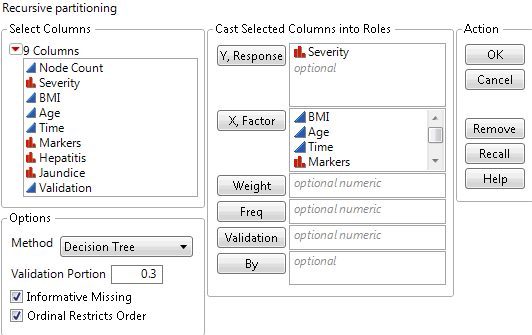
For JMP, enter 0.3 as the Validation Proportion.
|
|
6.
|
Click OK.
|
|
7.
|
|
9.
|
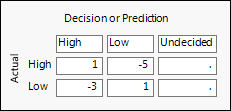
Click the red triangle next to Partition for Severity and select Specify Profit Matrix.
|
Figure 4.26 Completed Profit Matrix
|
11.
|
Click OK.
|
|
12.
|
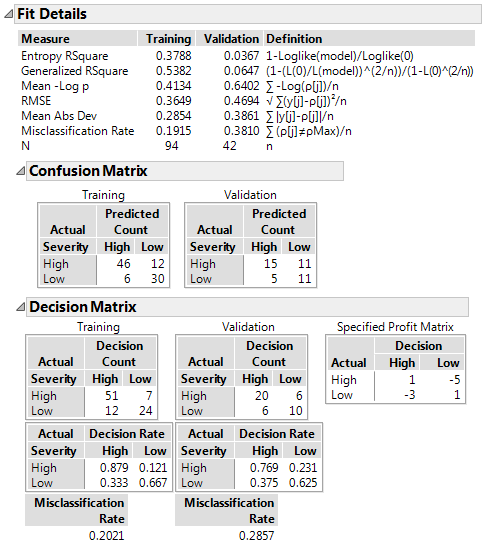
Click the red triangle next to Partition for Severity and select Show Fit Details.
|
Figure 4.27 Confusion Matrix and Decision Matrix Reports
|
13.
|
Click the red triangle next to Partition for Severity and select Save Columns > Save Prediction Formula.
|
 in the bottom right corner of the report window (Windows) or the Show Data Table icon on the tool bar menu (Macintosh).
|
–
|
The first three columns involve only the predicted probabilities. The confusion matrix counts are based on the Most Likely Severity column, which classifies a patient into the level with the highest predicted probability. These probabilities are given in the Prob(Severity == High) and Prob(Severity == Low) columns.
|
|
–
|
The last five columns involve the profit matrix weighting. The column called Most Profitable Prediction for Severity contains the decision based on the profit matrix. The decision for a patient is the level that results in the largest profit. The profits are given in the Profit for High and Profit for Low columns.
|