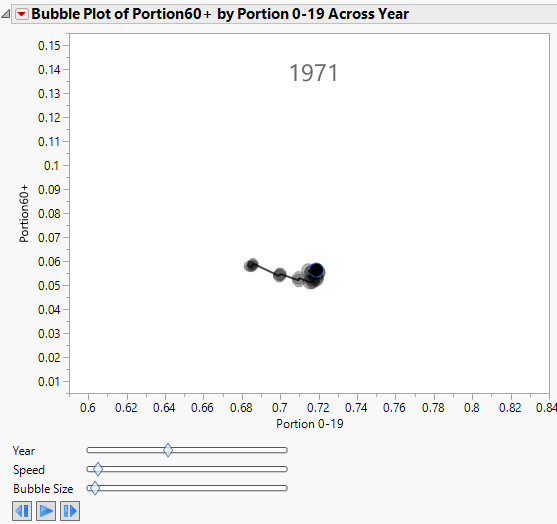
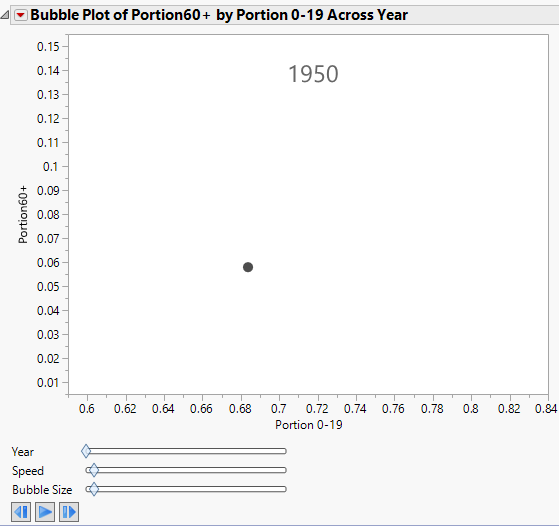
For dynamic bubble plots, you might specify only a Time variable and no ID variable. The resulting bubble plot contains a single moving bubble that tracks the series as the Time value changes.
|
1.
|
|
2.
|
Select Graph > Bubble Plot.
|
|
3.
|
|
4.
|
|
5.
|
|
6.
|
Click OK.
|
|
8.
|
Figure 7.8 Animated Bubble Plot over Time