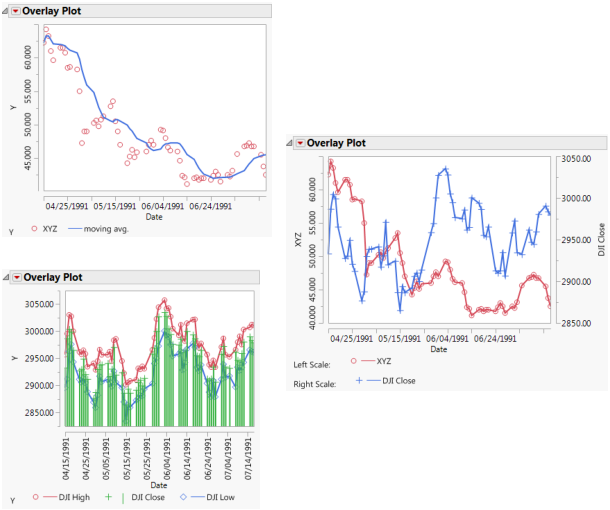
The Overlay Plot option produces plots of a single X column and one or more numeric Ys and does not accept non-numeric values for the y-axis. Curves can also be shown as separate plots for each Y with a common x-axis. Plots can be modified with range and needle options, color, log axes, and grid lines. Curves with two different scales can be overlaid on the same plot with the addition of a right axis.
Figure 4.1 Examples of Overlay Plot Graphs