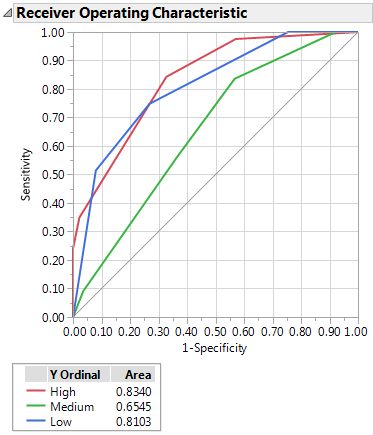
The ROC Curve option is available only for categorical responses. Receiver Operating Characteristic (ROC) curves display the efficiency of a model’s fitted probabilities in sorting the response levels. An introduction to ROC curves is found in ROC Curves in the Basic Analysis book.
The predicted response for each observation in a partition model is a value between 0 and 1. To use the predicted response to classify observations as positive or negative, a cut point is used. For example, if the cut point is 0.5, an observation with a predicted response at or above 0.5 would be classified as positive, and an observation below 0.5 as negative. There are trade offs in classification as the cut point is varied.
|
•
|
The sensitivity is the proportion of true positives or the percent of positive observations with a predicted response greater than the cut point.
|
|
•
|
The specificity is the proportion of true negatives or the proportion of negative observations with a predicted response less than the cut point.
|
The ROC curve plots sensitivity against 1 - specificity. A partition model with n splits has n+1 predicted values. The ROC curve for the partition model has n+1 line segments.
Figure 4.17 ROC Curves for a Three Level Response