The section Use Regression with One Predictor showed you how to build simple regression models consisting of one predictor variable and one response variable. Multiple regression predicts the average response variable using two or more predictor variables.
This example uses the Candy Bars.jmp data table, which contains nutrition information for candy bars.
|
•
|
Use multiple regression to predict the average response variable using these three predictor variables.
|
1.
|
|
2.
|
|
3.
|
|
4.
|
|
5.
|
Click OK.
|
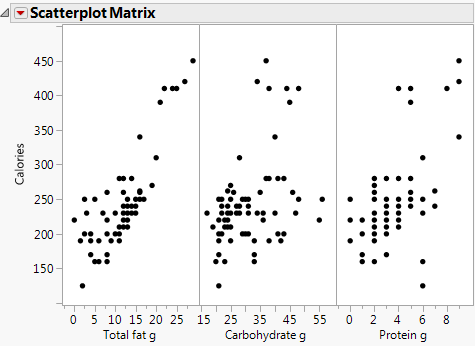
Figure 3.103 Scatterplot Matrix Results
Continue to use the Candy Bars.jmp sample data table.
|
1.
|
|
2.
|
|
3.
|
|
4.
|
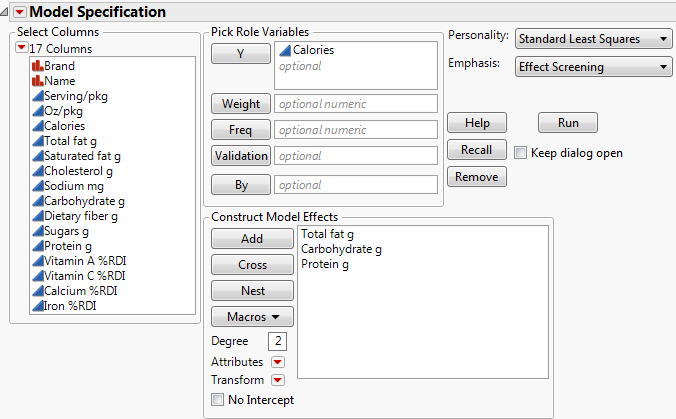
Next to Emphasis, select Effect Screening.
|
Figure 3.104 Fit Model Window
|
5.
|
Click Run.
|
Note: For complete details about all of the model results, see Model Specification in the Fitting Linear Models book.
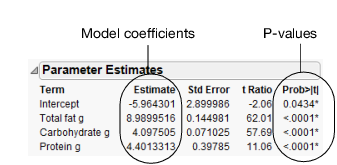
The Actual by Predicted Plot shows the actual calories versus the predicted calories. As the predicted values come closer to the actual values, the points on the scatterplot fall closer around the red line. See Figure 3.105. Because the points are all very close to the line, you can see that the model predicts calories based on the chosen factors well.
Figure 3.105 Actual by Predicted Plot
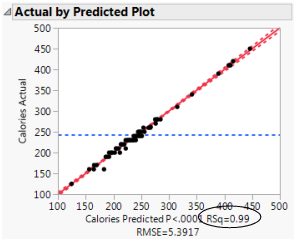
Another measure of model accuracy is the RSq value (which appears below the plot in Figure 3.105). The RSq value measures the percentage of variability in calories, as explained by the model. A value closer to 1 means a model is predicting well. In this example, the RSq value is 0.99.
Figure 3.106 Parameter Estimates Report
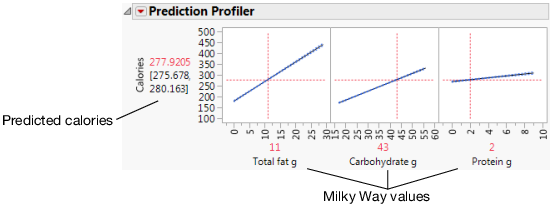
Use the Prediction Profiler to see how changes in the factors affect the predicted values. The profile lines show the magnitude of change in calories as the factor changes. The line for Total fat g is the steepest, meaning that changes in total fat have the largest effect on calories.
Figure 3.107 Prediction Profiler
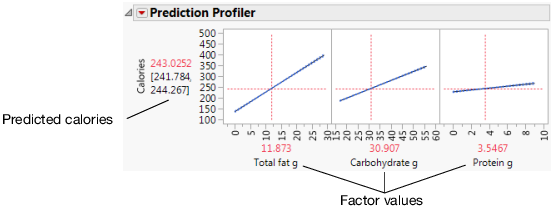
Figure 3.108 Factor Values for the Milky Way