|
1.
|
|
2.
|
Select Analyze > Quality and Process > Control Chart Builder.
|
|
3.
|
|
4.
|
Figure 3.26 XBar & R Chart for Fill Weight
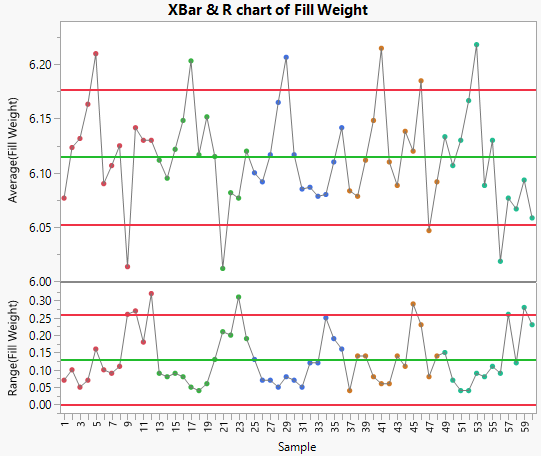
Notice that the Range chart (R-chart) plots the ranges of each sample. The limits for the Average (XBar) chart are calculated using the averages in the Range chart.
|
5.
|
At bottom left, click 3-Way Chart.
|
Figure 3.27 3-Way Chart for Fill Weight
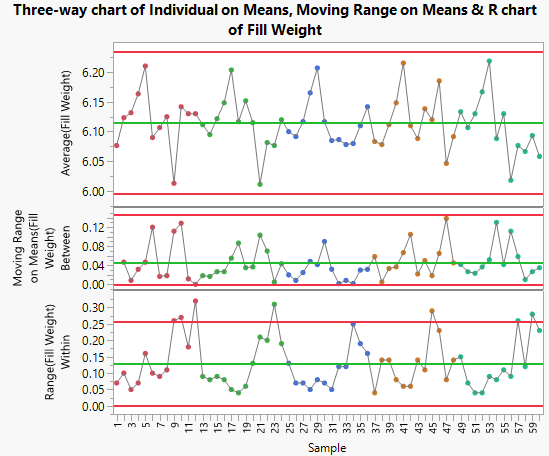
A Moving Range chart appears between the Range and Average charts. The limits on the Average (XBar) chart are now calculated using the moving range between each level of wafer in lot ID.