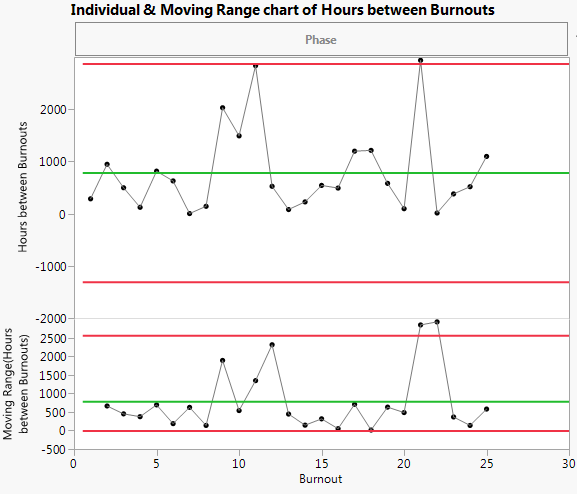
Rare event charts are helpful when you know your data will not follow a normal distribution (for example, when measuring counts or wait times). t-charts are used to measure the time that has elapsed since the last event. If you plot this type of data using a standard Shewhart control chart, you might see many more false signals, as the limits might be too narrow. The Fan Burnout.jmp sample data table contains simulated data for a fan manufacturing process. The first column identifies each fan that burned out. The second column identifies the number of hours between each burnout.
|
1.
|
|
2.
|
Select Analyze > Quality and Process > Control Chart Builder.
|
|
3.
|
|
4.
|
|
5.
|
To change the chart to a Rare Event chart, select Rare Event from the drop-down list.
|
|
6.
|
Figure 3.25 t-chart of Hours Between Burnouts