|
1.
|
|
2.
|
|
3.
|
|
4.
|
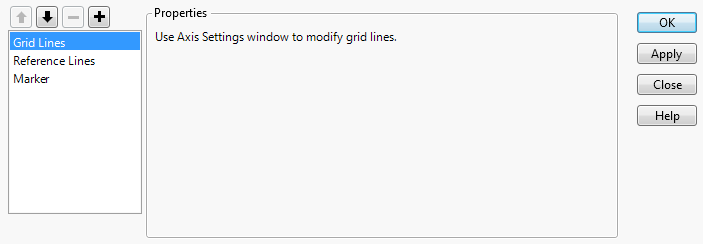
Right-click inside the graph and select Customize.
|
Figure 12.1 Customizing the Graph Options
|
5.
|
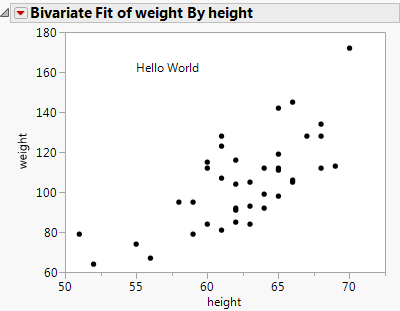
 to add a new graphics script.
Text( {55, 160}, "Hello World" );
Figure 12.2 Adding a Script to a Graph Interactively
Fill Color( "Green" ); Rect( 57, 175, 65, 110, 1 );
 .
. .
.
Tip: To use a script that references a column name, use Column( colname ) or a colon ( :colname ) to scope it properly.
Hint: To see the JSL for the above actions, select Save Script > To Script Window from the red triangle menu.