The Distribution platform illustrates the distribution of a single variable (univariate analysis) using histograms, additional graphs, and reports. The word univariate simply means involving one variable instead of two (bivariate) or many (multivariate). However, you can examine the distribution of several individual variables within a single report. The report content for each variable changes depending on whether the variable is categorical (nominal or ordinal) or continuous.
|
1.
|
|
2.
|
Select Analyze > Distribution.
|
|
3.
|
|
4.
|
The row that contains Fiber One in Cereal.jmp is labeled. This label shows the name of the cereal next to a data point in graphs. To see the entire label, drag the right-most vertical border to the right. Place your cursor over the unlabeled data point to see “All Bran with Extra Fiber”.
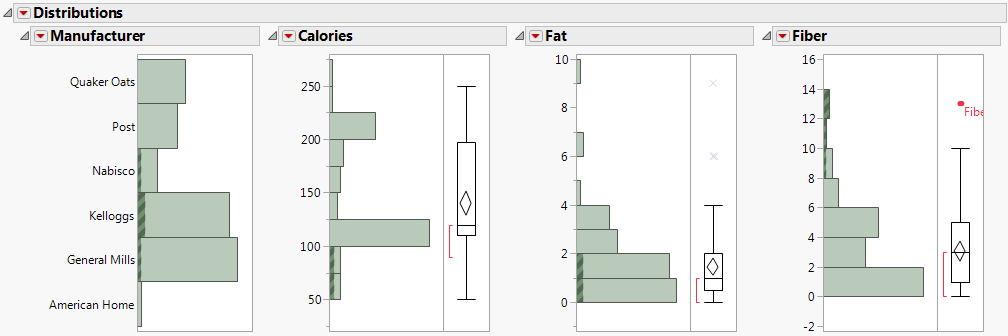
Figure .3 Distributions for Nabisco Cereals
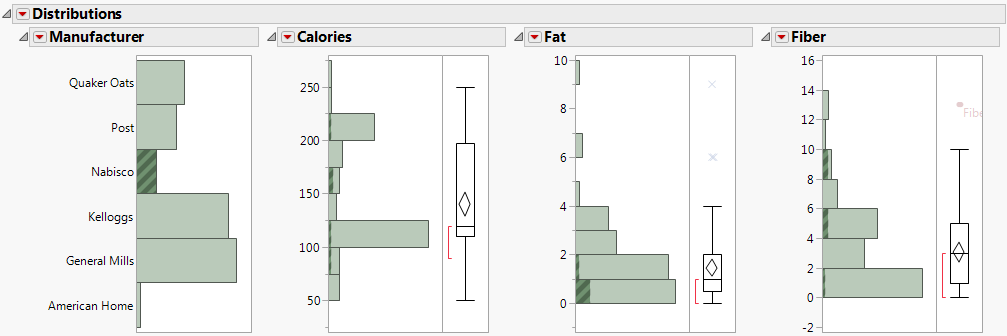
Figure .4 High-Fiber Cereals
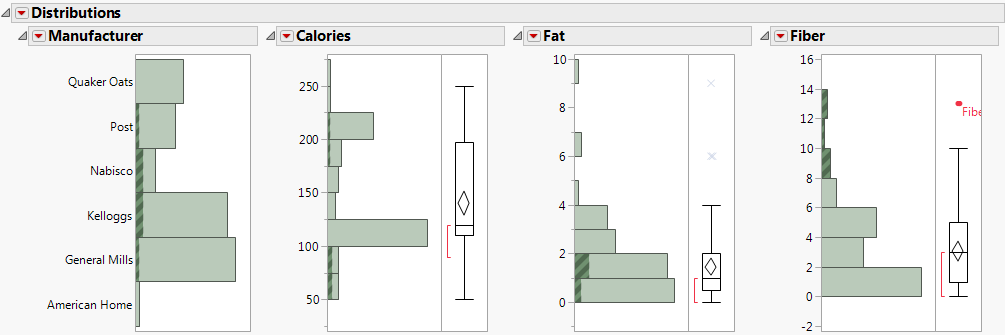
Figure .5 High-Fiber and Low-Calorie Cereals