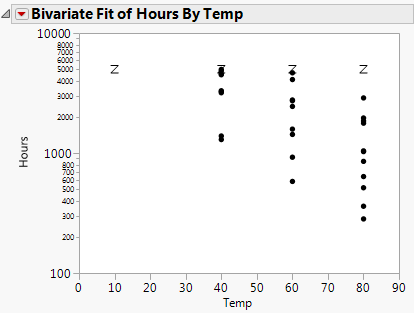
In the Devalt.jmp data, units are stressed by heating, in order to make them fail soon enough to obtain enough failures to fit the distribution.
|
1.
|
|
2.
|
Select Analyze > Fit Y by X.
|
|
3.
|
|
4.
|
|
5.
|
Click OK.
|
Figure 14.7 Bivariate Plot of Hours by Log Temp
|
6.
|
Select Analyze > Reliability and Survival > Survival.
|
|
7.
|
|
8.
|
|
9.
|
|
10.
|
|
11.
|
Click OK.
|
|
12.
|
|
13.
|
Click OK.
|
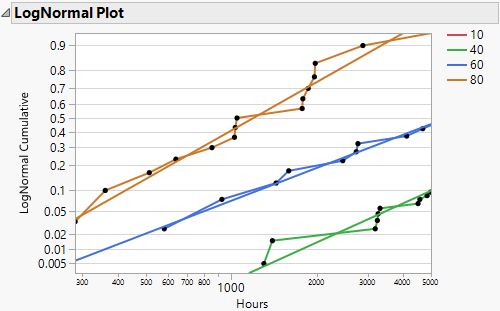
Figure 14.8 Lognormal Plot
|
14.
|
Select Analyze > Reliability and Survival > Fit Parametric Survival.
|
|
15.
|
|
16.
|
|
17.
|
|
18.
|
|
19.
|
|
20.
|
Click Run.
|
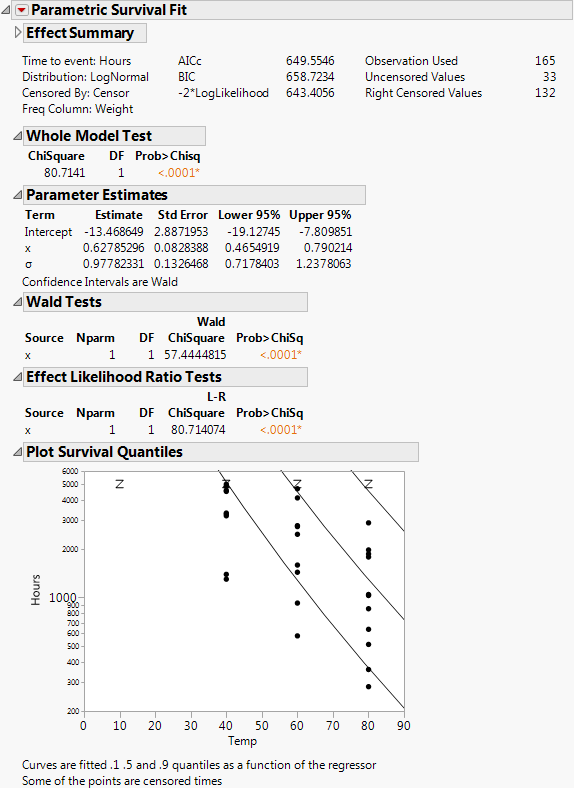
Figure 14.9 Devalt Parametric Output
|
–
|
If the effect column has a formula in terms of one other column, as in this case, the plot is done with respect to the inner column. In this case, the effect was the column x, but the plot is done with respect to Temp, of which x is a function.
|
|
21.
|
From the red triangle menu, select Estimate Survival Probability.
|
|
22.
|
Enter the values shown in Figure 14.10 into the Dialog to Estimate Survival.
|
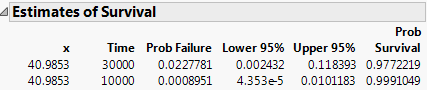
Figure 14.10 Estimating Survival Probabilities
|
23.
|
Click Go.
|
Figure 14.11 Survival Probabilities