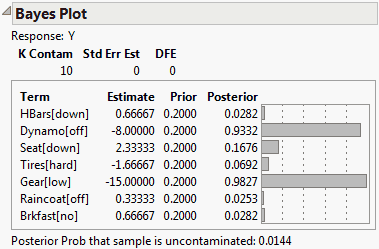
The Bayes Plot report gives another approach to determining which effects are active. This report helps you compute posterior probabilities using a Bayesian approach. This method, due to Box and Meyer (1986), assumes that the estimates are a mixture from two distributions. The majority of the estimates, corresponding to inactive effects, are assumed to be pure random normal noise with variance σ2. The remaining estimates, the active ones, are assumed to come from a contaminating distribution that has a variance K times larger than σ2.
Gives the parameter estimate. The Bayes plot is constructed with respect to estimates that have estimated standard deviation equal to 1. If the estimates are not correlated, the t-Ratio is used. If the estimates are correlated, the Orthog t-Ratio is used.
The value of the contamination coefficient, representing the ratio of the contaminating distribution variance to the error variance. K is commonly set to 10, which is the default value.
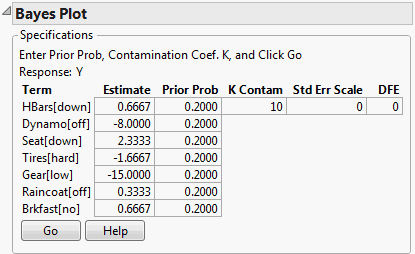
The specifications window, showing default settings for a Bayes Plot for the Bicycle.jmp sample data table, is shown in Figure 3.46. Clicking Go in this window updates the report to show Posterior probabilities for each of the terms and a bar chart (Figure 3.47).
|
1.
|
|
2.
|
Select Analyze > Fit Model.
|
|
3.
|
|
4.
|
|
5.
|
Click Run.
|
|
6.
|
From the red triangle menu next to Response Y, select Effect Screening > Bayes Plot.
|
Figure 3.46 Bayes Plot Specifications
|
7.
|
Click Go to calculate the posterior probabilities.
|
Figure 3.47 Bayes Plot Report