Analytic results are supported by compelling dynamic visualization tools such as profilers, contour plots, and surface plots (see the book Profilers). These visual displays stimulate, complement, and support your understanding of the model. They enable you to optimize several responses simultaneously and to explore the effect of noise.
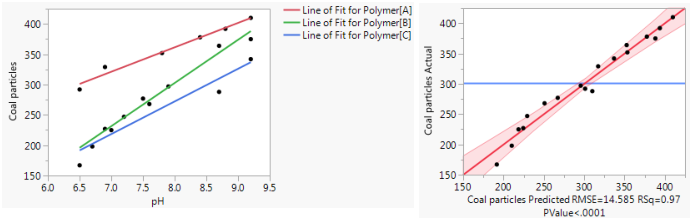
Figure 3.1 Examples of Standard Least Squares Plots