The Lack of Fit report gives details for a test that assesses whether the model fits the data well. The Lack of Fit report appears only when it is possible to conduct this test. The test relies on the ability to estimate the variance of the response using an estimate that is independent of the model. Constructing this estimate requires that response values are available at replicated values of the model effects. The test involves computing an estimate of pure error, based on a sum of squares, using these replicated observations.
|
•
|
There are no replicated points with respect to the X variables, so it is impossible to calculate a pure error sum of squares.
|
|
•
|
The model is saturated, meaning that there are as many estimated parameters as there are observations. Such a model fits perfectly, so it is impossible to assess lack of fit.
|
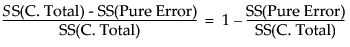
The difference between the error sum of squares from the model and the pure error sum of squares is called the lack of fit sum of squares. The lack of fit variation can be significantly greater than pure error variation if the model is not adequate. For example, you might have the wrong functional form for a predictor, or you might not have enough, or the correct, interaction effects in your model.
|
–
|
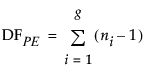
The Pure Error DF is pooled from each replicated group of observations. In general, if there are g groups and if each group has identical settings for each effect, the pure error DF, denoted DFPE, is as follows:
|
|
–
|
The Pure Error SS is the total of the sum of squares values for each replicated group of observations. The Pure Error SS divided by its DF estimates the variance of the response at a given predictor setting. This estimate is unaffected by the model. In general, if there are g groups and if each group has identical settings for each effect, the Pure Error SS, denoted SSPE, is as follows:
|
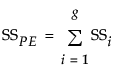
where SSi is the sum of the squared differences between each observed response and the mean response for the ith group.
The mean square for the Source, which is the Sum of Squares divided by the DF. A Lack of Fit mean square that is large compared to the Pure Error mean square suggests that the model is not fitting well. The F ratio provides a formal test.
The ratio of the Mean Square for Lack of Fit to the Mean Square for Pure Error. The F Ratio tests the hypothesis that the variances estimated by the Lack of Fit and Pure Error mean squares are equal, which is interpreted as representing “no lack of fit”.