Based on the fitting method selected, the Fit Least Squares report provides different analysis results and provide additional menu options for Save Columns and Profiler. In particular, the analysis of variance report is not shown because variances and degrees of freedom do not partition in the usual way. You can obtain the residual variance estimate from the REML Variance Component Estimates report. (See REML Variance Component Estimates.) The Effect Tests report is replaced by the Fixed Effect Tests report where fixed effects are tested. Additional reports give predicted values for the random effects and details about the variance components.
Figure 3.63 shows the report obtained for a fit to the Investment Castings.jmp sample data using the REML method. Run the script Model - REML, and then fit the model. Note that Casting is a random effect and is nested within Temperature.
Figure 3.63 Fit Least Squares Report for REML Method
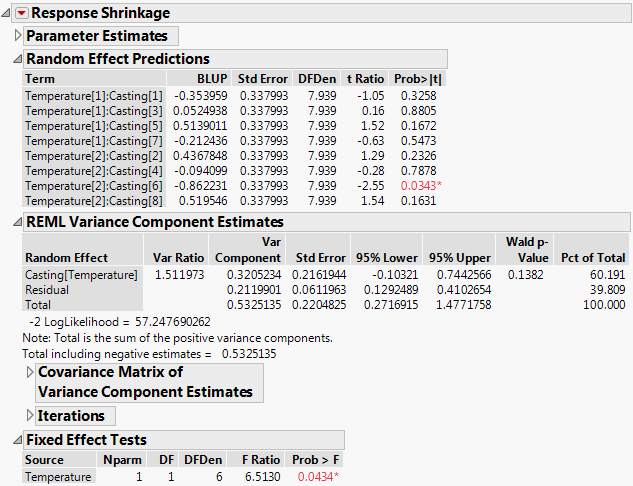
For each term in the model, this report gives an empirical estimate of its best linear unbiased predictor (BLUP) and a test for whether the corresponding coefficient is zero.
The empirical estimate of the best linear unbiased predictor (BLUP) for each random effect. See Best Linear Unbiased Predictors.
The denominator degrees of freedom for a test that the effect is zero. In most cases, the degrees of freedom for the t test is fractional.
The t ratio for testing that the effect is zero. The t ratio is obtained by dividing the BLUP by its standard error.
The p-value for the test.
The term best linear unbiased predictor (BLUP) refers to an estimator of a random effect. Specifically, it is an estimator that, among all unbiased estimators, minimizes mean square prediction error. The Random Effect Predictions report gives estimates of the BLUPs, or empirical BLUPs. These are empirical because the BLUPs depend on the values of the variance components, which are unknown. The estimated values of the variance components are substituted into the formulas for the BLUPs, resulting in the estimates shown in the report.
The lower 95% confidence limit for the variance component. See Confidence Intervals for Variance Components.
The upper 95% confidence limit for the variance component. See Confidence Intervals for Variance Components.
The p-value for the test that the covariance parameter is equal to zero. This column appears only when you have selected Unbounded Variance Components in the Fit Model launch window.
The Kackar-Harville correction. See Kackar-Harville Correction. This column appears only if you right-click in the report and select Columns > Norm KHC.
|
•
|
In the REML method, the standard errors of the fixed effects are estimated using estimates of the variance components. However, if variability in these estimates is not taken into account, the standard error is underestimated. To account for the increased variability, the covariance matrix of the fixed effects is adjusted using the Kackar-Harville correction (Kackar and Harville 1984; Kenward and Roger 1997). All calculations that involve the covariance matrix of the fixed effects use this correction. These include least squares means, fixed effect tests, confidence intervals, and prediction variances. For statistical details, see The Kackar-Harville Correction.
The estimates of σ2 and the variance components in G are obtained by maximizing a residual log-likelihood function that depends on only these parameters. An iterative procedure attempts to maximize the residual log-likelihood function, or equivalently, to minimize twice the negative of the residual log-likelihood (–2LogLike). The Iterations report provides details about this procedure.
The convergence criterion is based on the gradient, with a default tolerance of 10-8. You can change the criterion in the Fit Model launch window by selecting the option Convergence Settings > Convergence Limit and specifying the desired tolerance.
The denominator degrees of freedom. These are based on an approximation to the distribution of the statistic obtained when the covariance matrix is adjusted using the Kenward-Roger correction. See Kackar-Harville Correction and Random Effects.
The computed F ratio.
The p-value for the effect test.
When you use the REML method, six additional options appear in the Save Columns menu. These option names start with the adjective Conditional. This prefix indicates that the calculations for these columns use the predicted values for the terms associated with the random effects, rather than their expected values of zero.
 Publish Conditional Formula