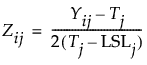
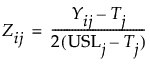
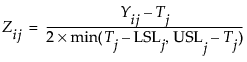
The Capability Box Plots show a box plot for each variable selected in the analysis. The values for each column are centered by their target value and scaled by the difference between the specification limits. If the target is not centered between the specification limits, the values are scaled by twice the minimum difference between the target and specification limits. For each process column Yj (see Notation for Goal Plots and Capability Box Plots for a description of the notation):
For a process with a one-sided specification, see One-Sided or Missing Specification Limits. For the situation where no target is specified, see Capability Box Plots for Processes with Missing Targets.
Note: Process variables with distributions other than Normal are not plotted on the Capability Box Plot.
Figure 11.11 shows a Capability Box Plots report for eight variables in the Semiconductor Capability.jmp sample data table.
Figure 11.12 Capability Box Plot
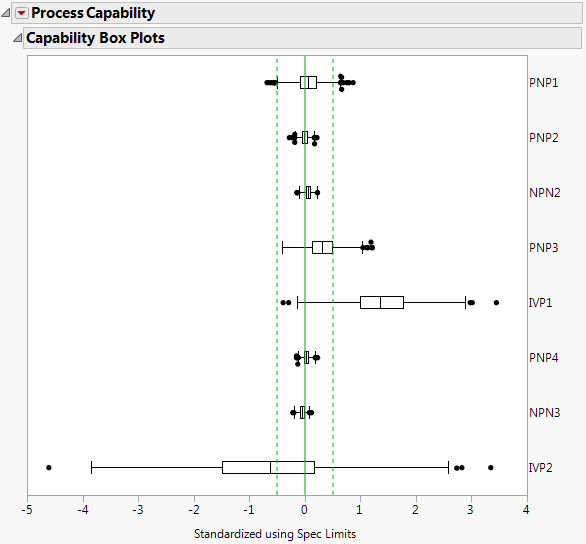
This plot is useful for comparing variables with respect to their specification limits. For example, in Figure 11.12, the majority of points for IVP1 are above its USL, and the majority of its points for IVP2 are less than its target. PNP2 seems to be on target with all data points in the specification limits.
Suppose that only the lower specification limit is specified and that the process target is specified. The capability box plot is based on the following values for the transformed observations. See Notation for Goal Plots and Capability Box Plots for a description of the notation: