The Goal Plot shows, for each variable, the spec-normalized mean shift on the x-axis, and the spec-normalized standard deviation on the y-axis. It is useful for getting a quick, summary view of how the variables are conforming to specification limits. By default, the Goal Plot shows only those points for each column that are calculated using the overall sigma. Hold your cursor over each point to view the variable name and the sigma method used to calculate the point. See Goal Plot for details about the calculation of the coordinates for the Goal Plot.
The points on the Goal Plot are also linked to the rows of the Goal Plot Summary Table, where each row corresponds to a column. You can select a point in the Goal Plot, right-click, and apply row states. These row states are applied to the rows of the Goal Plot Summary Table. Row states that you apply in the Goal Plot Summary Table are reflected in the Goal Plot. To see this table, select Make Goal Plot Summary Table from the Process Capability red triangle menu. See Make Goal Plot Summary Table.
Shows or hides the Ppk level shading. See Figure 11.11. When you select Shade Levels, shaded areas appear in the plot. The shaded areas are described as follows, with p representing the value shown in the box beneath Ppk:
|
–
|
|
–
|
Points in the green area have 2p < Ppk.
|
Figure 11.11 shows the Goal Plot for the entire data set for the Semiconductor Capability.jmp sample data table after selecting Shade Levels and Show Within Sigma Points from the Goal Plot red triangle menu.
Figure 11.11 Goal Plot
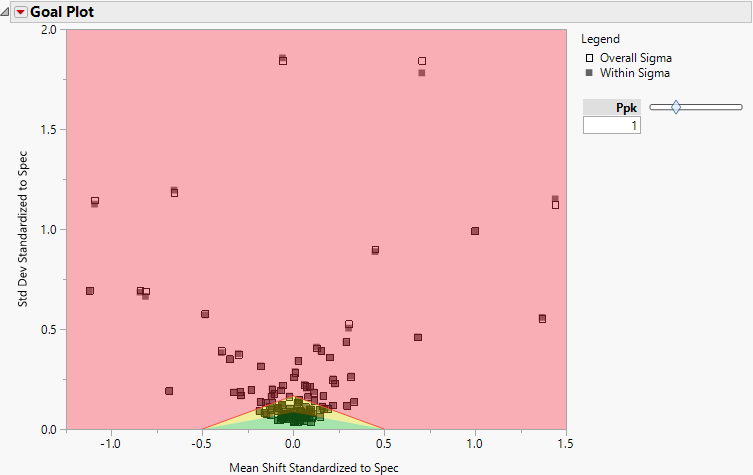
Processes with only an upper specification limit are represented by blue and should be compared to the blue (right) side of the goal triangle. Processes with only a lower specification limit are represented by red and should be compared to the red (left) side of the goal triangle. For details about how the coordinates of points are calculated, see Goal Plot.