Display segs (such as reference lines, grid lines, and contours) can be clipped to conform to the natural boundaries of the underlying data. This gives you a better view of the boundaries. For example, Figure 12.29 shows contours that are clipped to the boundaries of a map of the United States.
Figure 12.29 Unclipped (Left) and Clipped (Right) Boundaries
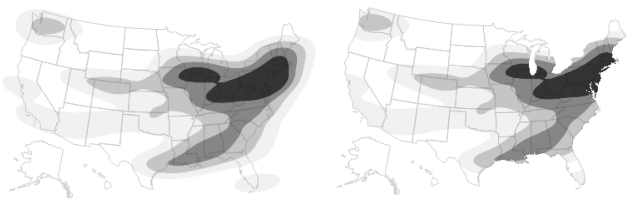
Send the Clip Shape message to the Contour Seg object to clip the display segs.
Open( "$SAMPLE_DATA/Cities.jmp" );
gb = Graph Builder(
Size( 653, 396 ),
Show Control Panel( 0 ),
Variables( X( :Longitude ), Y( :Latitude ) ),
Elements( Contour( X, Y, Legend( 2 ) ) ),
SendToReport(
Dispatch(
{},
"Graph Builder",
FrameBox,
{Background Map( Boundaries( "US States" ) ), Grid Line Order( 2 ), Reference Line Order( 3 )}
)
)
);
cs = (gb << Report)[FrameBox( 1 )] << Find Seg( Contour Seg( 1 ) );
Wait( 2 );
cs << Clip Shape( Boundaries( "US States" ) );
Tip: Clip Shape(Empty()) removes the clipping path.
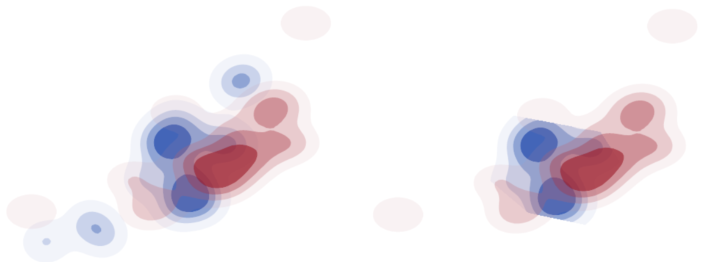
Open( "$SAMPLE_DATA/Big Class.jmp" );
gb = Graph Builder(
Show Control Panel( 0 ),
Variables( X( :height ), Y( :weight ), Overlay( :sex ) ),
Elements( Contour( X, Y, Legend( 3 ) ) )
);
r = (gb << Report);
cs = r[FrameBox( 1 )] << Find Seg( Contour Seg( 1 ) );
cs << Clip Shape( Path( [60 80 1, 50 140 2, 65 120 2, 70 65 -2] ) );
Figure 12.30 Unclipped (Left) and Clipped (Right) Contours