Select a distribution for the response. Different distributions appear based on characteristics of the data. For details about which distributions are available, see Available Parametric Distributions.
Tip: To customize the plot of the nonparametric estimates, select File > Preferences > Platforms > Life Distribution and select one or more of the following preferences: Show Shaded Pointwise Intervals, Show Shaded Simultaneous Intervals, or Show Staircase Style Function.
Tip: To hide the panel that contains markers for right-censored observations, select File > Preferences > Platforms > Life Distribution and uncheck Show Markers for Right Censored Observations.
|
•
|
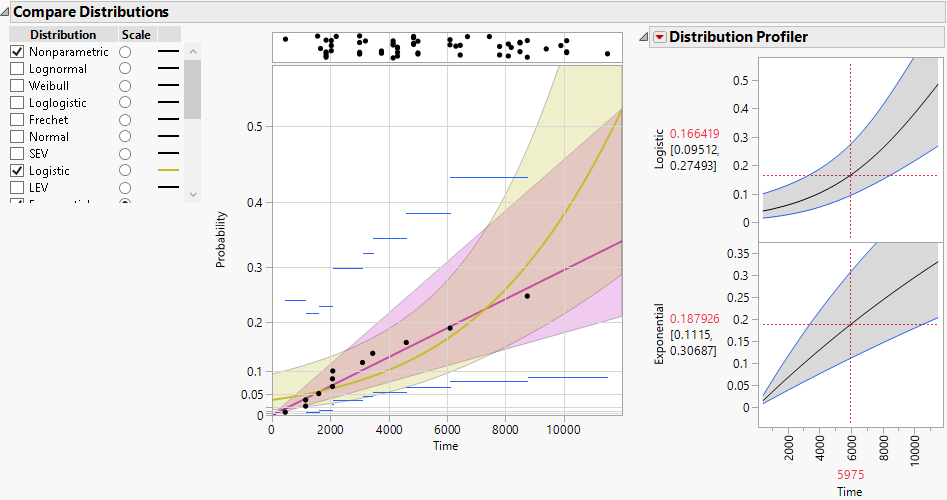
Figure 3.9 shows an example of the Compare Distributions report. The Logistic (yellow) and Exponential (magenta) distributions are shown. The plot is scaled using the Exponential distribution.
Note: Distributions for the Competing Cause report are covered in Available Distributions for Competing Cause Compare Distributions Reports.
The available distributions are listed and described in detail in Parametric Distributions. There are four major groupings of parametric distributions:
Tip: To restrict which distributions are available by default, select File > Preferences > Platforms > Life Distribution and uncheck the distributions that you do not want to appear. The distributions listed include the Threshold, Defective Subpopulation, Zero-Inflated, LogGenGamma, and GenGamma distributions. By default, all of the distributions are checked and available.
|
•
|
|
•
|
|
•
|
|
•
|
|
•
|
|
•
|
|
•
|
In the case of zero-failure data, none of the above distributions are available by default. To obtain Bayesian fits for those distributions where the Bayesian Estimate option is available, select File > Preferences > Platforms > Life Distribution and uncheck Weibayes Only for Zero Failure Data. See Weibayes Only for Zero Failure Data.
|
•
|
|
•
|
|
•
|
|
•
|
|
•
|
|
•
|