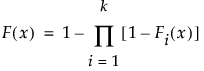
 , are individual failure distributions corresponding to causes. Confidence limits are readily available, because all involved estimates are MLEs.
|
1.
|
|
2.
|
|
3.
|
|
4.
|
|
5.
|
Select Likelihood as the Confidence Interval Method.
|
|
6.
|
Select Allow failure mode to use fixed parameter models.
|
|
7.
|
Click OK.
|
Figure 3.25 Fixed Parameter Model with Cause 1 Omitted
|
9.
|
Select Fix Parameter from the red triangle next to Parametric Estimate - Weibull.
|
|
10.
|
Select Weibull beta and type 2.
|
|
11.
|
Click Update.
|
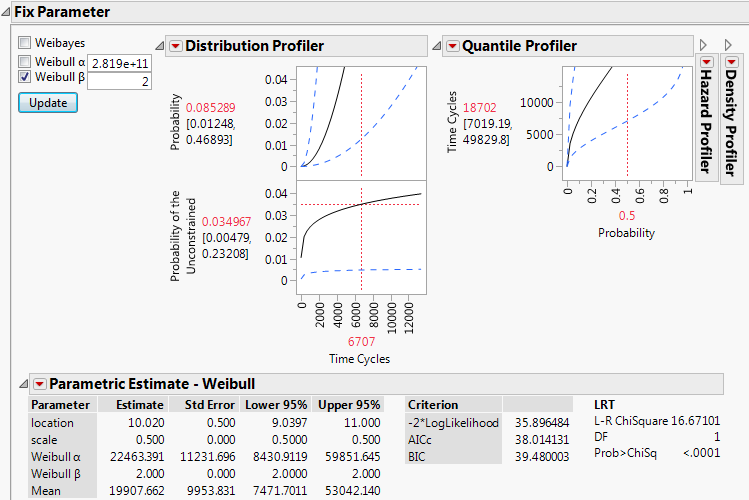
In the Parametric Estimate - Weibull report, assuming β equals 2, the alpha parameter is estimated to be 22463.391. Now you can use this for the failure distribution for Cause=1.
|
13.
|
Deselect Omit for Cause 1.
|
|
14.
|
For the distribution for Cause 1, select Fixed Parameter Weibull.
|
|
15.
|
Click Update Model.
|
Figure 3.27 Updated Model Showing Cause 1
The steps for specifying a Bayesian model for a cause are similar to those described in Specify a Fixed Parameter Model as a Distribution for a Cause. Define the model in the desired Bayesian Estimation report found in the corresponding Parametric Estimate outline under Statistics in the Life Distribution report for the individual cause. See Bayesian Estimation - <Distribution Name>.
To incorporate a Bayesian model into the aggregated model, non-Bayesian distributions for other causes must be amenable to a simulation-based framework. For example, suppose that a model has two failure causes. One is modeled using a Weibull distribution and the other using a Bayesian approach for estimating the parameters of a second Weibull. The parameters for the first Weibull distribution, denoted by the vector θ1, are estimated using maximum likelihood. The parameters for the second Weibull, θ2, are estimated using the Bayesian approach.
 , are obtained as follows:
 . Denote a sampled value from the asymptotic distribution of
  by
by  .
.|
•
|
 .
. and
and  , an estimate of
  , denoted by
  , is obtained.
 are used to obtain estimates of the quantiles and median of the aggregated distribution. These are the values displayed in the Distribution profiler at a given value of
 The steps for specifying a Weibayes model for a cause are similar to those described in Specify a Fixed Parameter Model as a Distribution for a Cause. Select the Fix Parameter option in the Parametric Estimate - Weibull outline under Statistics in the Life Distribution report for the cause. In the Fix Parameter report, check the Weibayes option. The Weibayes model is treated as a Bayesian model and a bootstrap sample is drawn from the posterior distribution of the parameter alpha. See Liu and Wang (2013).
To obtain an estimate of the mean remaining life at time t, m samples are drawn from the aggregated distribution conditioned on survival to time t. Their average is computed.
To compute the confidence interval, n samples of parameter estimates are drawn from either the asymptotic distributions of the MLEs, or the posterior distributions derived using Bayesian inference. For each sample of parameter values, an aggregated distribution is formed, from which m samples are drawn to compute a mean remaining life. The samples of n mean remaining life values are used to construct the confidence interval.
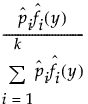
 is an estimate of the mixture proportion,
  is the estimated probability distribution function
  is the estimated probability density function for
 |
–
|
If the observation y is not censored, the saved value is given by the following:
|
 for right censoring
 for left censoring
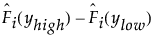 for interval censoring