There are five Drag() functions to perform similar functions to Handle() and Mousetrap() but with more than one point at a time. For n coordinates in matrices listed as the first two arguments:
|
•
|
Drag Marker() draws n markers.
|
|
•
|
 segments.
|
•
|
Drag Rect() draw a filled rectangle using the first two coordinates, ignoring any further coordinates.
|
|
•
|
Drag Polygon() draws a filled polygon with n vertices.
|
|
•
|
Drag Text() draws a text item at the coordinates. Or if there is a list of text items, it draws the ith list item at the ith (x,y) coordinate. If there are fewer list items than coordinate pairs, the last item is repeated for remaining points.
|
Drag Marker( xMatrix, yMatrix, dragScript, mouseupScript );
Drag Line( xMatrix, yMatrix, dragScript, mouseupScript );
Drag Rect( xMatrix, yMatrix, dragScript, mouseupScript );
Drag Polygon( xMatrix, yMatrix, dragScript, mouseupScript );
Drag Text( xMatrix, yMatrix, "text", dragScript, mouseupScript );
They all must have L-value arguments for the coordinates. The coordinates are literal matrices or names of matrix values that are modified if you click a vertex and drag it to a new position. The script arguments are optional and behave the same as with Handle(). However, there is no x nor y that is modified as in Handle().
Drag() functions are ways to display data that the user can adjust and then capture the adjusted values. Consider the earlier script to draw the JMP man. Drag Polygon() makes it possible to draw an editable JMP man; using a matching Drag Marker() statement makes the vertices more visible. And, similar to the Mousetrap() example, you can save the new coordinates to a data table. Notice how : and :: operators avoid ambiguity among matrices and data table columns with the same names.
You could just as easily put storepoints in the fourth argument of Drag Polygon() or Drag Marker(), but that would create a data table after each drag. You probably just want a single data table when you are finished. Regardless, the values in gCoordX and gCoordY update with each drag.
::i = 1;
storepoints = Expr(
mydt = New Table( "My coordinates" || Char( i ) );
i++;
New Column( "GCoordX", Numeric );
New Column( "GCoordY", Numeric );
mydt << Add Rows( N Row( GcoordX ) );
:GCoordX << Values( ::GcoordX );
:GCoordY << Values( ::GcoordY );
);
::GcoordX = [25, 23.75, 22.5, 21.25, 21.25, 22.5, 23.75, 25.625, 27.5, 18.75, 12.5, 6.25, 2.5, 1.25, -1.25, 3.125, 6.25, 12.5, 18.75, 25, 29.375, 34.375, 37.5, 38.75, 40.625, 42.5, 43.125, 42.5, 41.25, 38.75, 43.75, 50, 56.25, 60.625, 63.75, 65.625, 62.5, 56.25, 50, 45, 37.5, 32.5, 28.75, 27.5, 26.25, 25.625, 25];
::GcoordY = [-2, 2, 5, 10, 15, 20, 25, 30, 33, 34, 35, 37.5, 40, 41, 43.5, 41, 40, 39, 40, 42, 45, 50, 55, 60, 64, 60, 55, 50, 47, 42, 43.5, 43, 42, 40, 38, 36, 37, 37, 36, 35, 30, 25, 20, 15, 10, 5, 2];
win = New Window( "Redraw the JMP Man!",
V List Box(
Graph Box(
Frame Size( 300, 300 ),
X Scale( -10, 80 ),
Y Scale( -10, 80 ),
Fill Color( "blue" );
Drag Polygon( GcoordX, GCoordY );
Pen Color( "gray" );
Drag Marker( GcoordX, GCoordY );
Fill Color( {0, 0, 0} );
Circle( {18, 58}, 9, "FILL" );
),
Button Box( "Store current vertices in a new data table", storepoints )
)
);
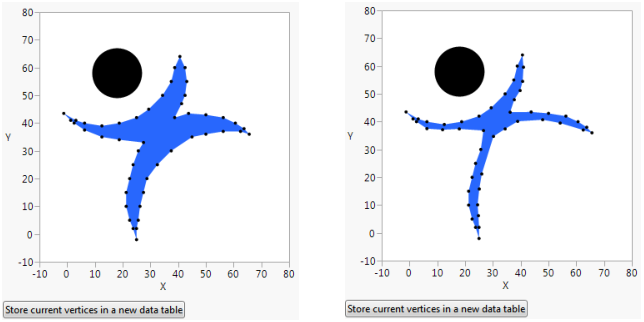
Suppose you want the body of the JMP man to be smaller. Here is how he looks before and after some judicious vertex-dragging. Clicking the button after re-shaping the JMP Man executes the storepoints script to save his new, slender figure in a data table of coordinates.
Figure 12.28 Redraw the JMP Man
|
•
|
Button Box(), which creates controls outside the graph.
|
|
•
|
V List Box(), which combined the graph box and the button box in the same graph window.
|