Mousetrap() takes arguments for a graph from the coordinates of a mouse click. The first script is executed after each mousedown and the second script after each mouseup to update the graph dynamically, according to the new coordinates of the handle. As with Handle, it is important to set the initial values for the Mousetrap’s coordinates. If you include both Mousetrap() and Handle() in a graph, put the Handle() before the Mousetrap(). Then Handle() has a chance to catch clicks before a Mousetrap() does.
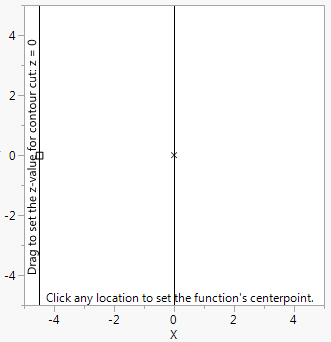
This example uses both Mousetrap() and Handle() to draw a three-dimensional function centered on the Mousetrap() coordinates, where the single contour line takes its value from a Handle().
x0 = 0;
y0 = 0;
z0 = 0;
win = New Window( "Viewing a 3-D Function in Flatland",
Graph Box(
Frame Size( 300, 300 ),
X Scale( -5, 5 ),
Y Scale( -5, 5 ),
Contour Function(
Exp( -(x - x0) ^ 2 ) * Exp( -(y - y0) ^ 2 ) * (x - x0),
x,
y,
z0 / 10
);
Handle( -4.5, z0, z0 = Round( y * 10 ) / 10 );
// get the z-cut values from a handle
V Line( -4.5 );
Text Size( 9 );
Text(
Counterclockwise,
{-4.6, -4},
"Drag to set the z-value for contour cut: z = " || Char( z0 / 10 )
);
Marker Size( 2 );
Marker( 2, {x0, y0} );
Mousetrap( // set the origin to the click-point
x0 = x;
y0 = y;
);
Text(
{-4.25, -4.9},
"Click any location to set the function's centerpoint."
);
)
);
Note: Instead of setting x0 to x and y0 to y in the Mousetrap() expression, you might want to use Function( {xx, yy}, Show( xx, yy ); x0 = xx; y0 = yy );. xx and yy are formal parameters to the function. They come from arguments that the mousetrap passed when the user clicked on the graph. The Function( {xx, yy}...) alternative makes the xx and yy names explicit, and makes it clear the you can name them anything, not just x, y.
Figure 12.27 Mousetrap() and Handle()
You might use Mousetrap() to collect points in a data table, such as for visually interpolating points in a graph. The following example illustrates a script that could be adapted and added to a data plot (such as a scatterplot from Fit Y by X) for that purpose. After you run the script and click in the graph, the point at which you click is recorded in the data table.
dt = New Table( "dat1" );
New Column( "xx", Numeric );
New Column( "yy", Numeric );
x = 0;
y = 0;
Add Point = Expr(
dt << Add Rows( 1 );
Row() = N Row();
:xx = x;
:yy = y;
);
win = New Window( "Add Points",
Graph Box(
Frame Size( 500, 300 ),
X Scale( -5, 5 ),
Y Scale( -5, 5 ),
For Each Row( Marker( {xx, yy} ) );
Mousetrap( {}, Add Point );
)
);