Arrow() draws an arrow from the first point to the second point. The default arrowhead is scaled to 1 plus the square root of the length of the arrow. To set the length of the arrowhead, add an optional first argument, specifying the length of the arrowhead in pixels. The following example draws simple arrows.
win = New Window( "Arrowheads",
Graph Box(
Pen Size( 4 );
Arrow( 20, [10 30 90], [88 22 44] );
// matrix 1 defines an arrow from 10, 88 to
// 30, 22 (the x coordinates)
// matrix 2 defines an arrow that starts at the end of line 1
// and ends at 90, 44 (the y coordinates)
)
);
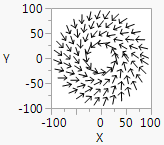
win = New Window( "Hurricane",
Graph Box(
Frame Size( 100, 100 ),
X Scale( -100, 100 ),
Y Scale( -100, 100 ),
For( r = 35, r < 100, r += 20,
ainc = 2 * Pi() * 3 / r;
For( a = 0, a < 2 * Pi(), a += ainc,
x = r * Cosine( a );
y = r * Sine( a );
aa = a + ainc * 45 / r;
rr = r - r / 6;
x2 = rr * Cosine( aa );
y2 = rr * Sine( aa );
Arrow( {x, y}, {x2, y2} );
// list 1 defines the start point for the arrow
// list 2 defines the end point for the arrow
);
)
)
);
Figure 12.11 Drawing Arrows
win = New Window( "Arrowheads",
Graph Box(
Frame Size( 300, 300 ),
X Scale( 0, 100 ),
Y Scale( 0, 220 ),
x = 10;
y1 = 10;
y2 = y1 + 10;
For( i = 1, i < 10, i++,
Pen Color( "Red" );
Arrow( {x, y1}, {x, y2} );
y2 += 10;
y1 += 100;
y2 += 100;
Pen Color( "Blue" );
Arrow( 20, {x, y1}, {x, y2} );
x += 10;
y1 -= 100;
y2 -= 100;
Text Color( "Red" );
Text( {10, 80}, "Without Length Arg" );
Text Color( "Blue" );
Text( {10, 200}, "With Length Arg" );
);
)
);
Figure 12.12 Arrowhead Sizes
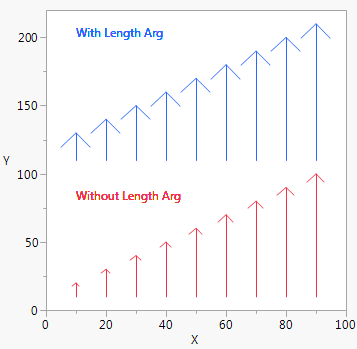
As with Line(), you can either specify the points in two-item lists as demonstrated above or as matrices of x and then y coordinates.