|
1.
|
|
2.
|
Select Analyze > Quality and Process > CUSUM Control Chart.
|
|
3.
|
|
4.
|
Click OK.
|
Figure 5.2 CUSUM Control Chart Report
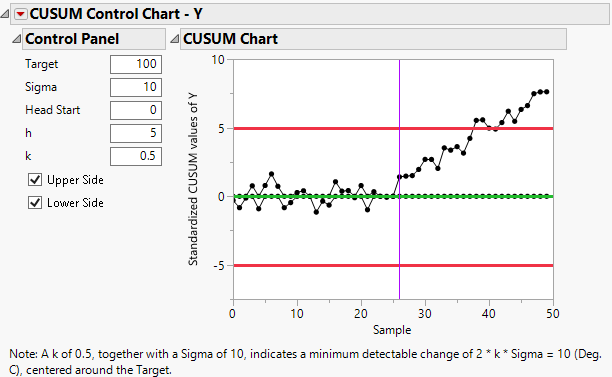
Note: You can compare this result to the Individual Moving Range control chart by running the IMR Chart table script in Engine Temperature Sensor.jmp. The IMR chart does not trigger any of the Nelson tests.