This example tests for practical differences using the Probe.jmp sample data table.
|
1.
|
|
2.
|
Select Analyze > Screening > Response Screening.
|
|
3.
|
|
4.
|
|
6.
|
Click OK.
|
|
7.
|
From the Response Screening report’s red triangle menu, select Save Compare Means.
|
Figure 18.12 shows a portion of the data table. For each response in Y, the corresponding row gives information about tests of the New and the Old levels of Process.
Figure 18.12 Compare Means Table, Partial View
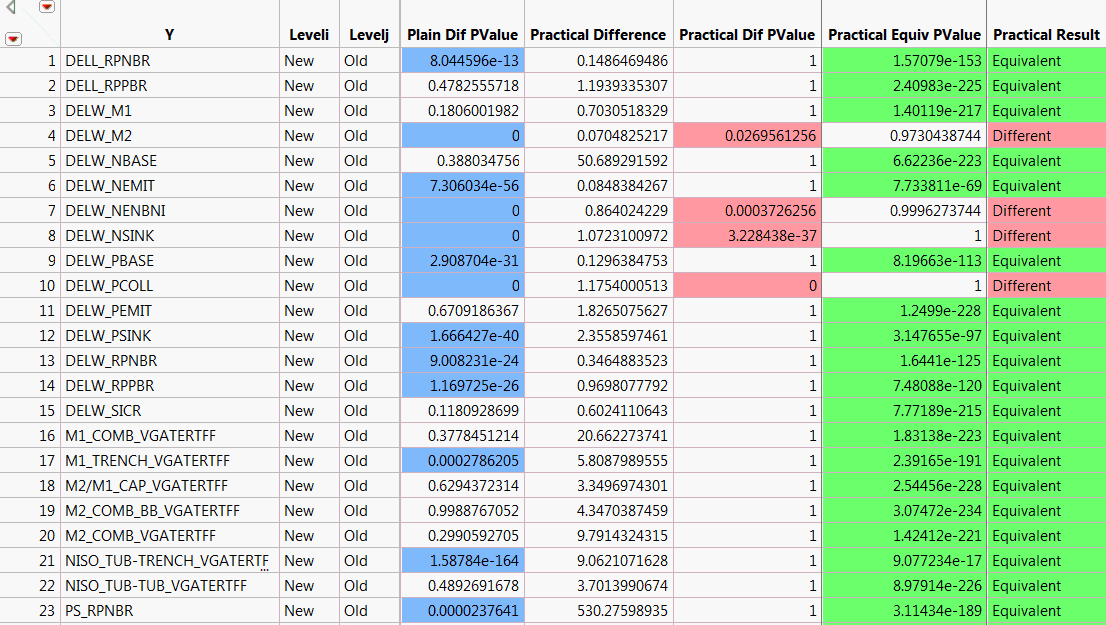
Because specification limits are not saved as column properties in Probe.jmp, JMP calculates a value of the practical difference for each response. The practical difference of 0.15 that you specified is multiplied by an estimate of the 6σ range of the response. This value is used in testing for practical difference and equivalence. It is shown in the Practical Difference column.
The Plain Difference column shows responses whose p-values indicate significance. The Practical Diff PValue and Practical Equiv PValue columns give the p-values for tests of practical difference and practical equivalence. Note that many columns show statistically significant differences, but do not show practically significant differences.
|
8.
|
Display the Compare Means data table and select Analyze > Distribution.
|
|
9.
|
|
10.
|
Click OK.
|
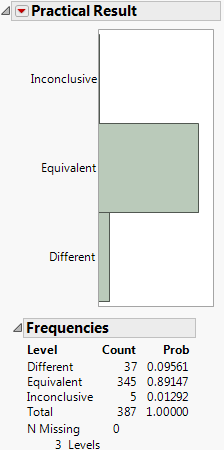
Figure 18.13 shows the distribution of results for practical significance. Only 37 tests are different, as determined by testing for the specified practical difference. For 5 of the responses, the tests were inconclusive. You cannot tell whether the responses result in a practical difference across Process.
Figure 18.13 Distribution of Practical Significance Results