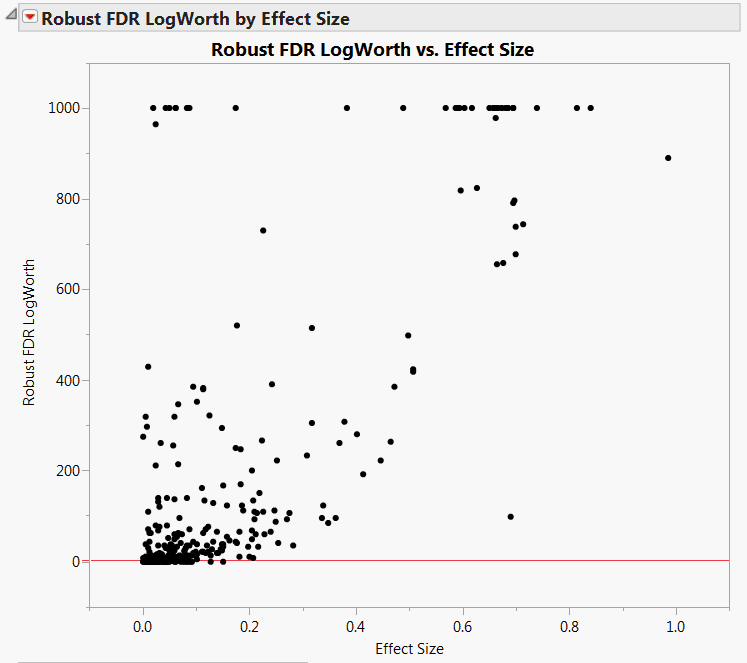
When data sets have a large number of observations, p-values can be very small. LogWorth values provide a useful way to study p-values graphically in these cases. But sometimes p-values are so small that the LogWorth scale is distorted by huge values.
|
1.
|
|
2.
|
Select Analyze > Screening > Response Screening.
|
|
3.
|
|
4.
|
|
5.
|
Select the Robust check box.
|
|
6.
|
Click OK.
|
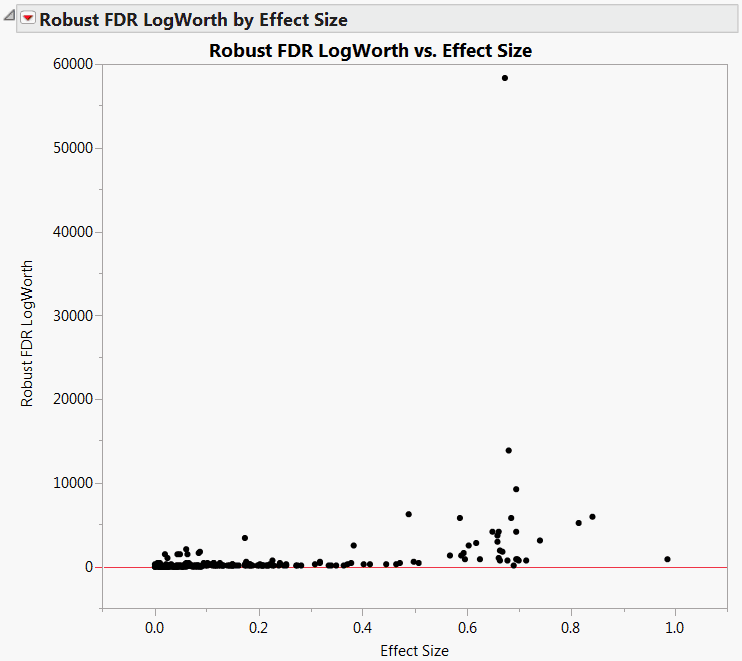
The detail in the plot is difficult to see, because of the huge Robust FDR LogWorth value of about 58,000 (Figure 18.14). To ensure that your graphs show sufficient detail, you can set a maximum value of the LogWorth.
|
10.
|
Click OK.
|

