This example uses the Semiconductor Capability.jmp sample data table. The variables represent standard measurements that a semiconductor manufacturer might make on a wafer as it is being processed. Specification limits for the variables have been entered in the data table through the Column Properties > Spec Limits property.
|
1.
|
|
2.
|
Select Analyze > Quality and Process > Process Capability.
|
|
3.
|
Click the white triangle next to Processes to view all of the continuous variables.
|
|
4.
|
|
5.
|
Click OK.
|
|
6.
|
Select Label Overall Sigma Points from the Goal Plot red triangle menu.
|
|
7.
|
Select Label Overall Sigma Points from the Capability Index Plot red triangle menu.
|
Figure 11.2 Example Results for Semiconductor Capability.jmp
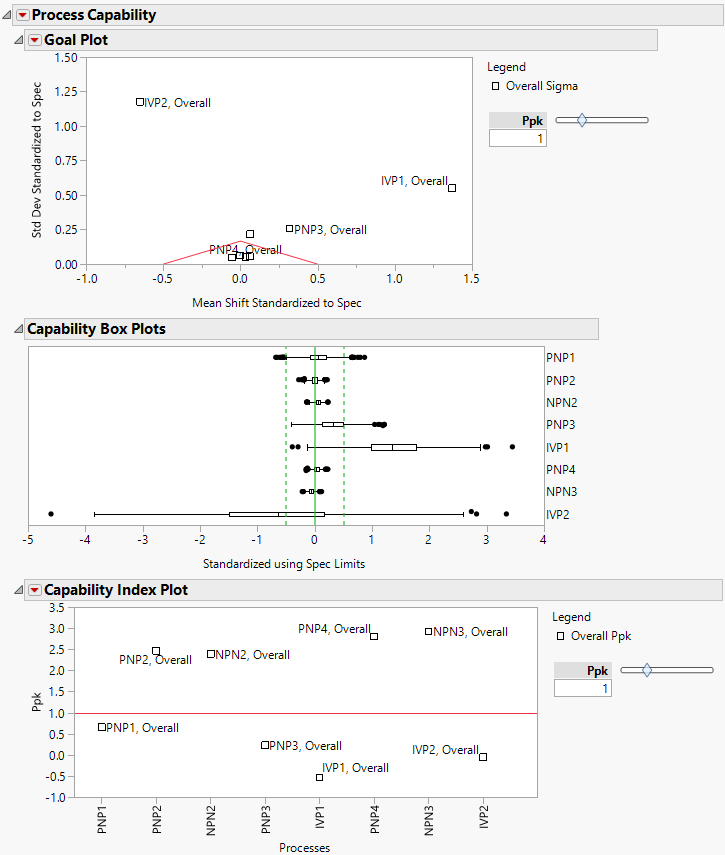
The Goal Plot in Figure 11.2 shows the spec-normalized mean shift on the x-axis and the spec-normalized standard deviation on the y-axis for each variable. The triangular region defined by the red lines in the bottom center of the plot is the goal triangle. It defines a region of capability index values. You can adjust the goal triangle using the Ppk slider to the right of the plot. When the slider is set to 1, note that PNP1, PNP3, IVP1, and IVP2 are outside of the goal triangle and possibly out of specification.
It appears that the majority of points for IVP1 are above its upper specification limit (USL), and the majority of points for IVP2 are less than its target. PNP2 seems to be on target with all data values inside the specification limits.