The Process Measurements.jmp data table contains measurements made on seven different processes used to construct a product. For each process, specification limits are saved as column properties. You begin by examining the distributions of your process data. You see that the distributions are not normal. Then you use the nonnormal capability features of the Process Capability platform to compute capability indices.
|
1.
|
|
2.
|
Select Analyze > Distribution.
|
|
3.
|
|
4.
|
Check the box next to Histograms Only.
|
|
5.
|
Click OK.
|
|
1.
|
Select Analyze > Quality and Process > Process Capability.
|
|
2.
|
|
3.
|
Select all seven columns in the Y, Process list.
|
|
4.
|
|
5.
|
Click Set Process Distribution.
|
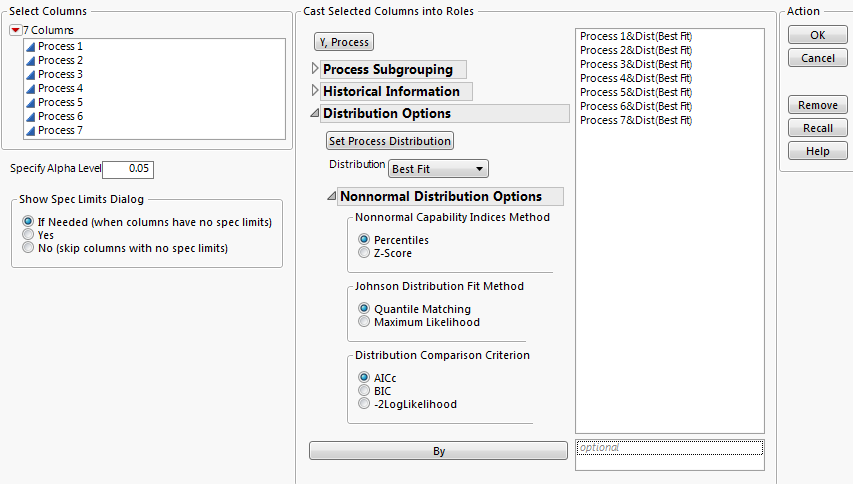
The suffix &Dist(Best Fit) is added to each variable name in the Y, Process list. The Best Fit option specifies that the best-fitting parametric distribution should be fit to each variable. The available parametric distributions are normal, beta, exponential, gamma, Johnson, lognormal, and Weibull. See Figure 11.3.
|
6.
|
Open the Nonnormal Distribution Options outline. Note that the Nonnormal Capability Indices Method is set to Percentiles, the Johnson Distribution Fitting Method is set to Quantile Matching, and the Distribution Comparison Criterion is set to AICc.
|
Figure 11.3 Completed Launch Window
|
7.
|
Click OK.
|
|
8.
|
From the Goal Plot red triangle menu, select Label Overall Sigma Points.
|
|
9.
|
From the Capability Index Plot red triangle menu, select Label Overall Sigma Points.
|
Figure 11.4 Initial Report with Variables Labeled
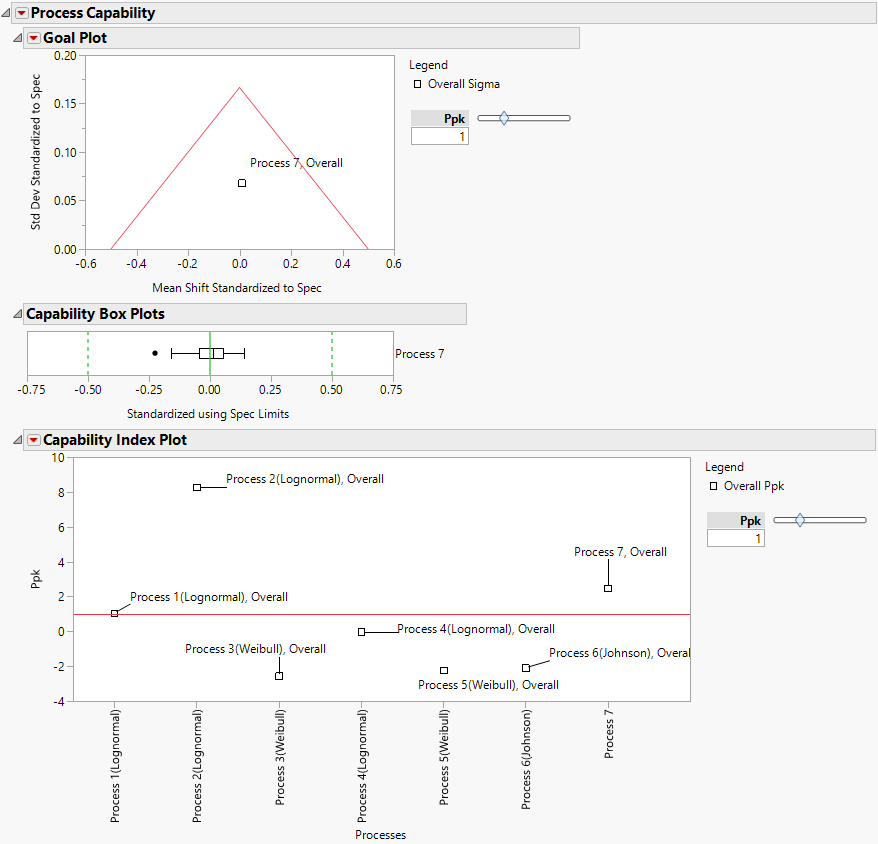
The Goal Plot shows only one point and it corresponds to Process 7. The Capability Box Plots report shows a single box plot for Process 7. This is because the best fit for Process 7 is a normal distribution.
The Capability Index Plot shows Ppk values for all seven processes. Only two processes, Process 2 and Process 7, have capability values that exceed 2. Note that the best fitting nonnormal distributions are shown in parentheses to the right of the variable names in the Capability Index Plot. The best fitting distribution for Process 7 is not shown because it is a normal distribution.
|
11.
|
Select Individual Detail Reports from the Process Capability red triangle menu.
|
|
12.
|
Scroll to the report entitled Process 4(Lognormal) Capability.
|
Figure 11.5 Individual Detail Report for Process 4
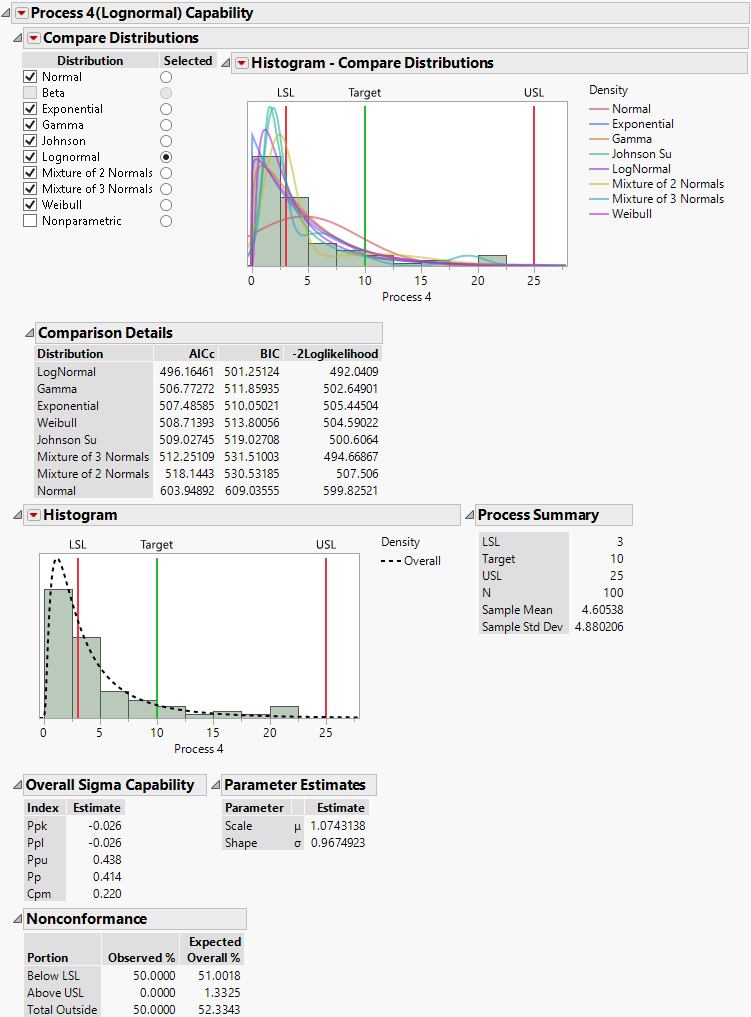
The title of the report for Process 4 indicates that the capability calculations are based on a lognormal fit. All of the check boxes in the Compare Distributions report, except the boxes for Nonparametric and Beta, are checked, indicating that these six distributions are fit. (This is because you requested a Best Fit in the launch window.) The button that is selected in the Selected column indicates that the Lognormal distribution is the distribution that is used in the remainder of the Process 4(Lognormal) Capability report to estimate capability and nonconformance.