|
1.
|
|
2.
|
Select Analyze > Reliability and Survival > Life Distribution.
|
|
3.
|
|
4.
|
Click OK.
|
|
5.
|
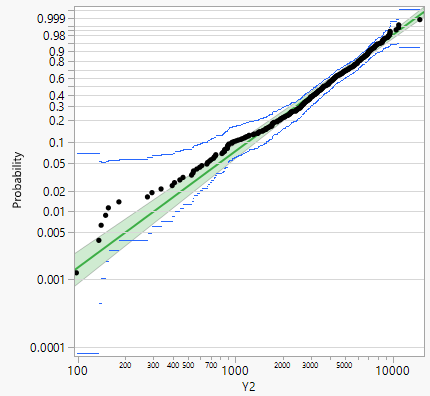
In the Compare Distributions report, select Weibull distribution and the corresponding Scale radio button.
|
A probability plot for a single Weibull distribution fit appears in Figure 3.23. Note that the fit is not very good in the lower part of the range of Y2.
Figure 3.23 Weibull Distribution Fit
|
6.
|
From the Life Distribution red triangle menu, select Fit Competing Risk Mixture.
|
|
7.
|
|
8.
|
Click Go.
|
|
9.
|
|
10.
|
|
11.
|
Do the same for the horizontal axis. In the probability plot, right-click on the horizontal axis and select Edit > Copy Axis Settings.
|
|
12.
|
In the overlay plot, right-click on the horizontal axis and select Edit > Paste Axis Settings.
|
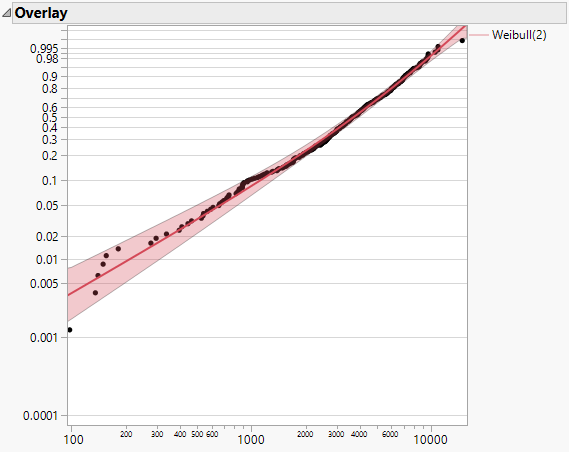
The probability plot for the Weibull(2) distribution fit appears in Figure 3.24. Note that the mixture of two Weibull distributions helps better capture the distribution in the lower part of the range of Y2.