|
1.
|
|
2.
|
Select Analyze > Reliability and Survival > Life Distribution.
|
|
3.
|
|
4.
|
Click OK.
|
|
5.
|
Select Fit Mixture from the red triangle menu next to Life Distribution.
|
|
6.
|
|
7.
|
Select Separable Clusters in the Starting Value Methods panel.
|
|
8.
|
Click Go.
|
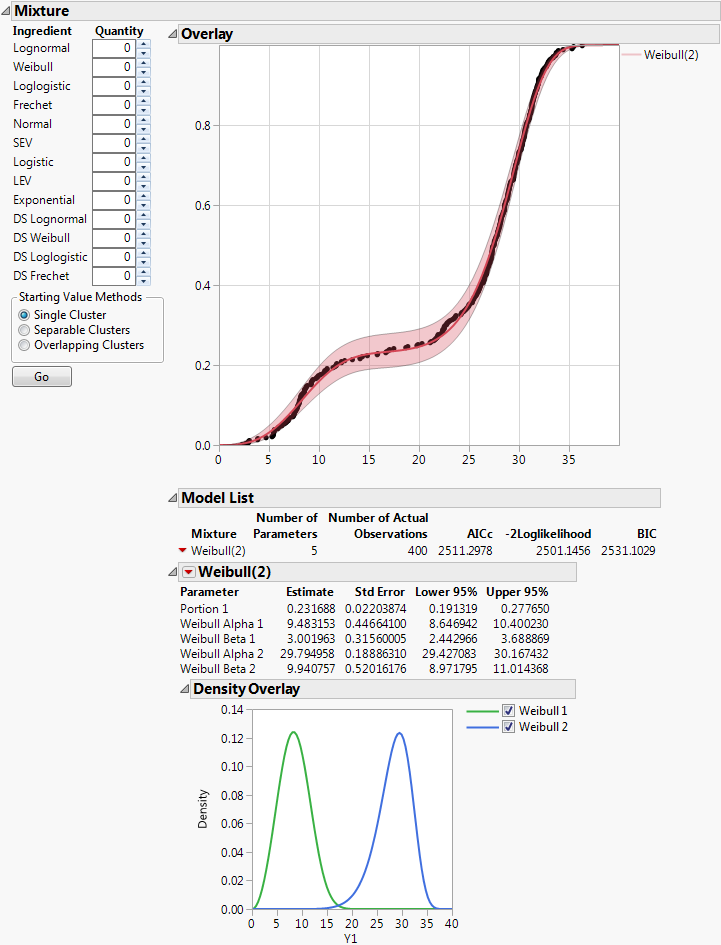
Figure 3.20 Fit Mixture for Weibull (2)
|
9.
|
|
10.
|
Click Go.
|
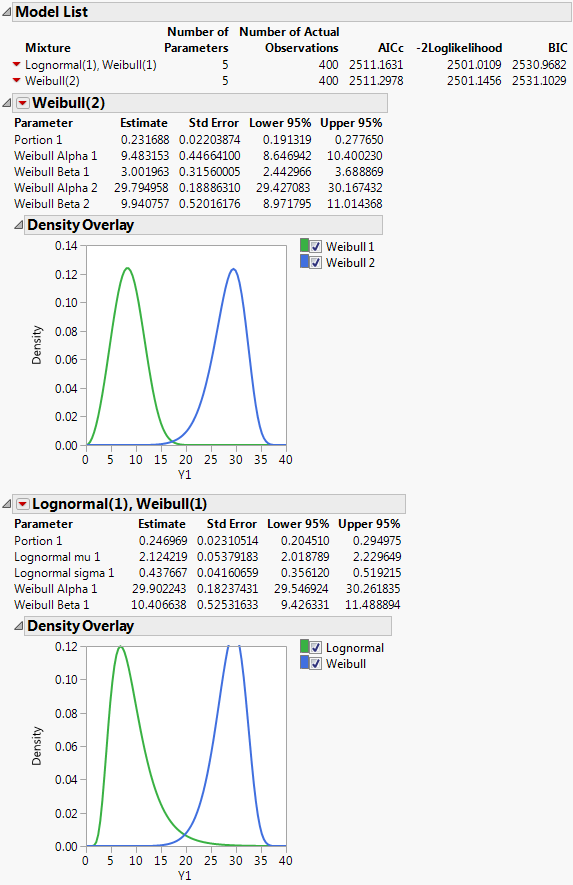
Figure 3.21 Fit Mixture for Lognormal(1), Weibull(1)
|
1.
|
From the Lognormal(1), Weibull(1) red triangle menu, select Save Predictions.
|
|
2.
|
Select Analyze > Distribution.
|
|
4.
|
Check Histograms Only.
|
|
5.
|
Click OK.
|
|
6.
|
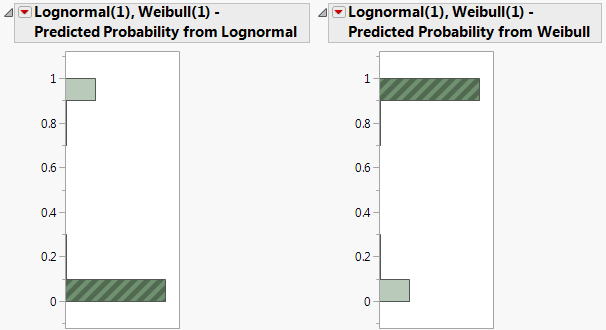
In the histogram for Lognormal(1), Weibull(1) - Predicted Probability from Weibull, click in the bar corresponding to the value near 1.
|
Figure 3.22 Histograms for Mixture Probabilities