Figure 6.7 Example of a One-Sided CUSUM Chart
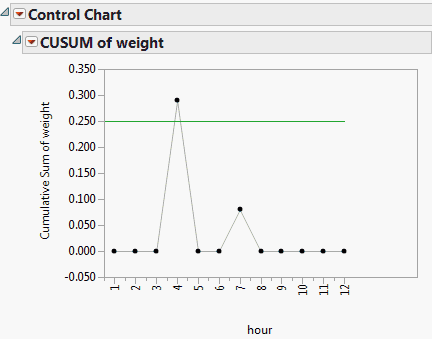
The decision interval or horizontal line is set at the H value that you entered in the launch window. In this example, it is 0.25. Any values exceeding the decision interval of 0.25 indicate a shift or out-of-control condition. In this example, observation 4 appears to be where a shift occurred. Also note that no V-mask appears for one-sided CUSUM charts.