To interpret a two-sided CUSUM chart, compare the points with limits that compose a V-mask. A V-mask is a shape in the form of a V on its side that is superimposed on the graph of the cumulative sums. The V-mask is formed by plotting V-shaped limits. The origin of a V-mask is the most recently plotted point, and the arms extended backward on the x-axis, as in Figure 6.6. As data are collected, the cumulative sum sequence is updated and the origin is relocated at the newest point.
Figure 6.6 V-Mask for a Two-Sided CUSUM Chart
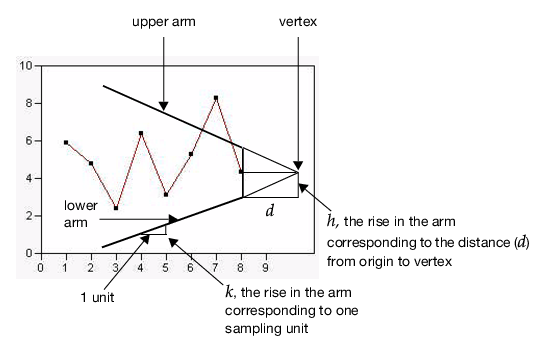
Shifts in the process mean are visually easy to detect on a CUSUM chart because they produce a change in the slope of the plotted points. The point where the slope changes is the point where the shift occurs. A condition is out-of-control if one or more of the points previously plotted crosses the upper or lower arm of the V-mask. Points crossing the lower arm signal an increasing process mean, and points crossing the upper arm signal a downward shift.
|
•
|
The control limits on a Shewhart control chart are commonly specified as 3σ limits. On a CUSUM chart, the limits are determined from average run length.
|
A CUSUM chart is more efficient for detecting small shifts in the process mean. Lucas (1976) states that a V-mask detects a 1σ shift about four times as fast as a Shewhart control chart.