This example uses the Fish Patty.jmp sample data table. The data, adapted from Cornell (1990), comes from an experiment to optimize the texture of fish patties. The columns Mullet, Sheepshead, and Croaker are mixture components. Each column represents the proportion of a fish type in the fish patty. The Temperature column is a process variable. It is the oven temperature used to bake the patties. The column Rating is the response and is a measure of texture acceptability, where higher is better. A response surface model was fit to the data and the prediction formula was stored in the column Predicted Rating.
|
1.
|
|
2.
|
Select Graph > Mixture Profiler.
|
|
3.
|
|
4.
|
Click OK.
|
Figure 6.8 Initial Output for Mixture Profiler
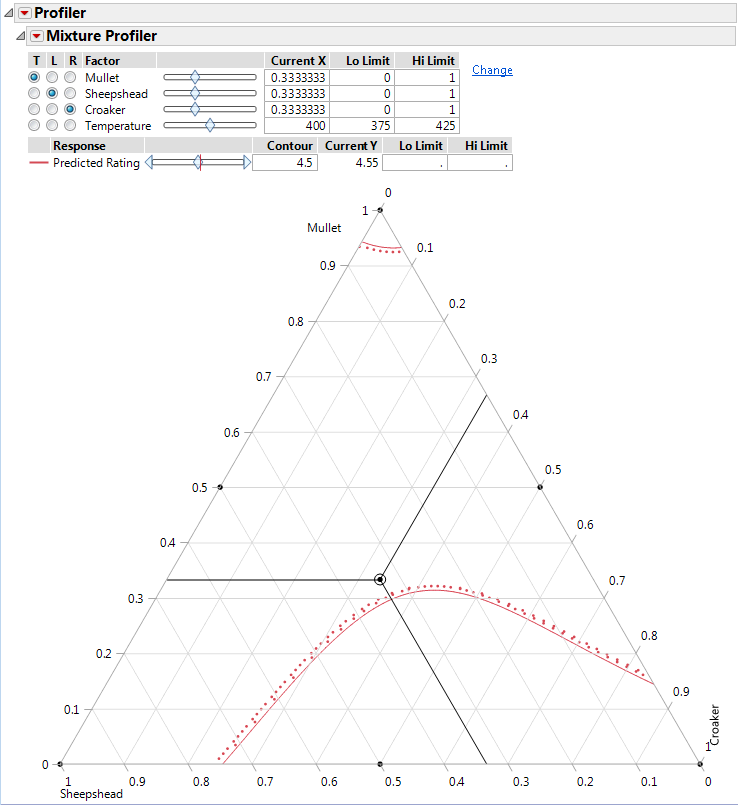
|
5.
|
The manufacturer wants the rating to be at least 5. Use the slider control for Predicted Rating to move the contour close to 5. Alternatively, you can enter 5 in the Contour edit box to set the contour to 5.
|
Figure 6.9 Contour Showing a Predicted Rating of 5
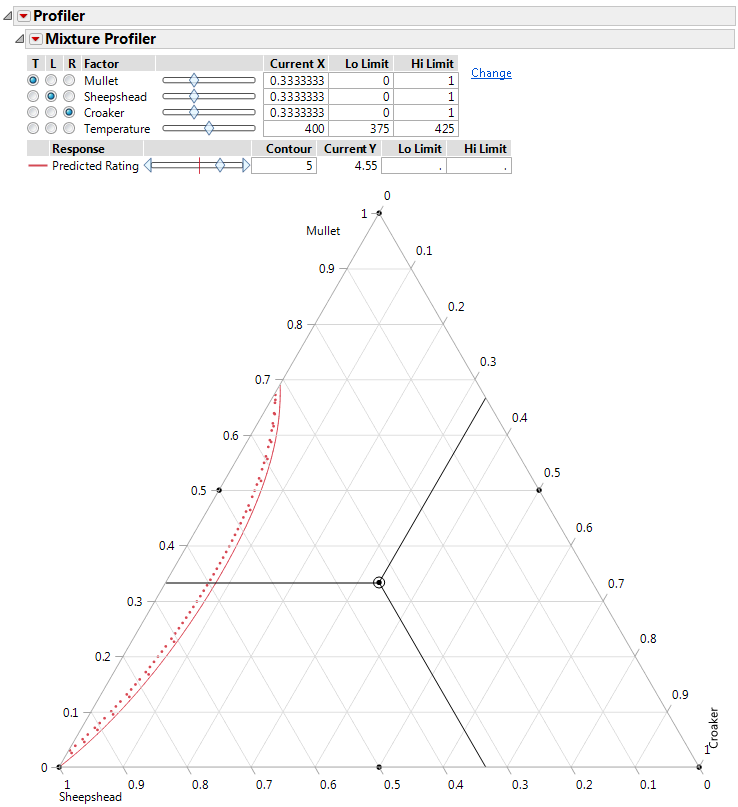
The Up Dots shown along the contour indicate the direction of increasing Predicted Rating.
|
6.
|
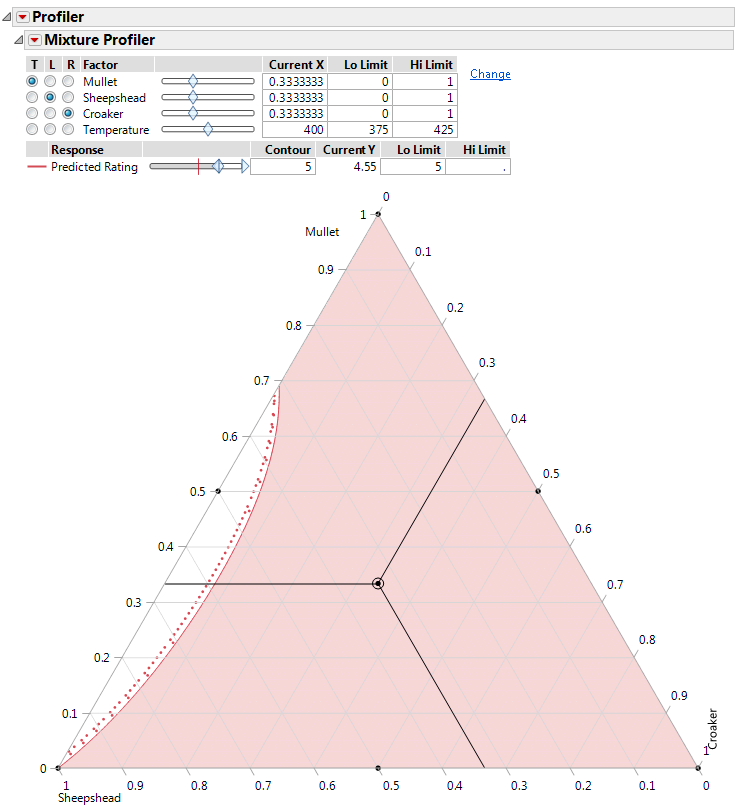
Enter 5 in the Lo Limit edit box for the Predicted Rating. The resulting shaded region represents factor combinations that yield a rating less than 5. To produce patties with at least a rating of 5, the manufacturer can set the factors values anywhere in the feasible (unshaded) region. The region has small proportions of Croaker (<10%), mid to low proportions of Mullet (<70%) and mid to high proportions of Sheepshead (>30%). This region is for a baking temperature of 400 degrees.
|
|
7.
|
Move the slide control for Temperature to observe how the feasible region changes for different temperature settings.
|
|
•
|