|
1.
|
|
2.
|
Select Analyze > Quality and Process > Control Chart Builder.
|
|
3.
|
|
4.
|
Figure 11.21 XBar and R Control Chart for Gap
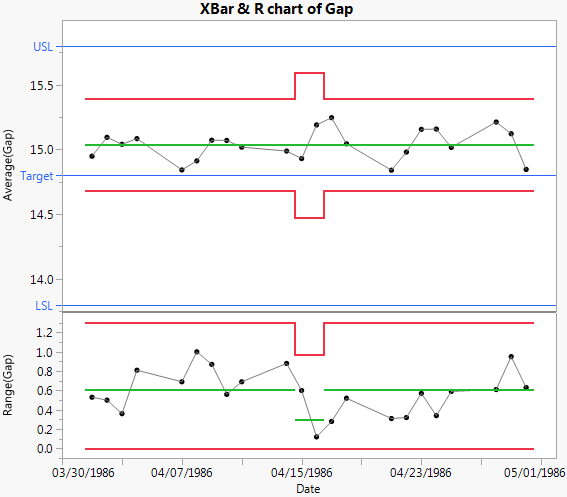
The control chart indicates that Gap is stable over time. Because Gap has the Spec Limits column property, a Process Capability Analysis report appears to the right of the control chart.
Figure 11.22 Histogram in Process Capability Analysis for Gap
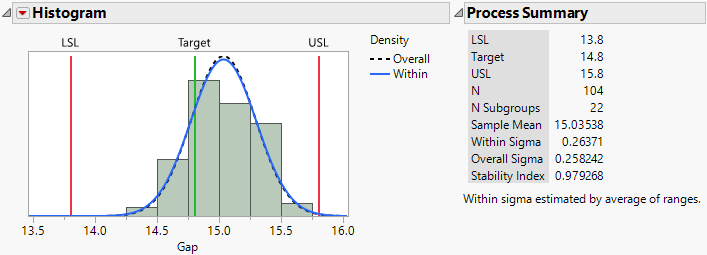
The histogram and fitted normal blue curve suggest that the distribution of Gap is approximately normal. Although the process is stable, the distribution of Gap is shifted to the right of the specification range.
|
5.
|
Right-click in the body of the Nonconformance report and select Expected Within PPM from the Columns submenu.
|
Figure 11.23 Capability Indices and Nonconformance Report
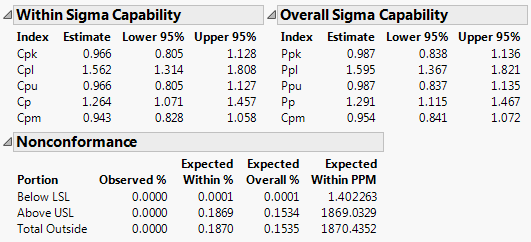
The estimates of out-of-specification product given in the Nonconformance report provide a direct measure of process performance. The PPM values in the Nonconformance report indicate that Gap hardly ever falls below the lower specification limit (1.4 parts per million). However, the number of parts for which Gap falls above the upper specification limit is 1869.0 parts per million.
|
1.
|
Select Analyze > Quality and Process > Process Capability.
|
|
2.
|
|
3.
|
Open the Process Subgrouping outline.
|
|
4.
|
|
5.
|
Click Nest Subgroup ID Column.
|
By default, the Within-Subgroup Variation Statistic selection is set to Average of Unbiased Standard Deviations. In the Control Chart Builder example (Process Capability through Control Chart Builder), subgroup ranges were used.
|
6.
|
Click OK.
|
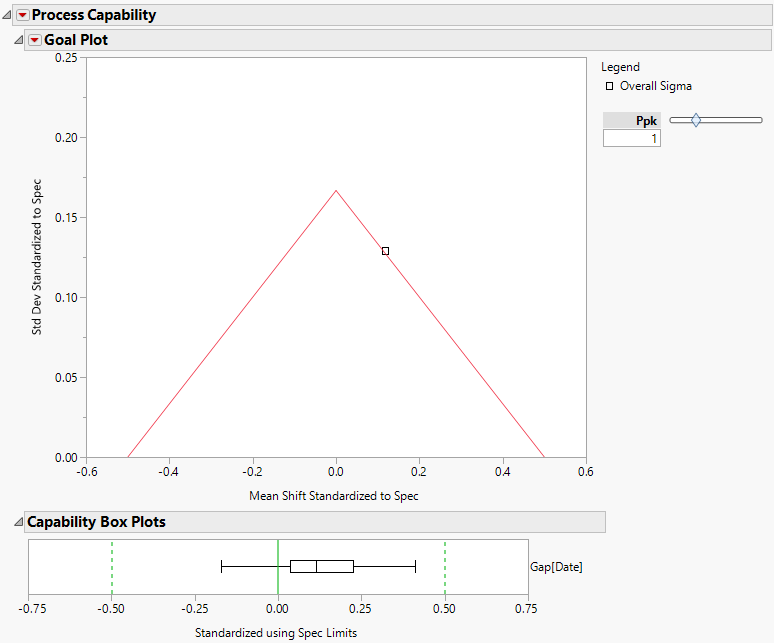
Figure 11.24 Goal Plot and Box Plot for Gap