The following example shows a case where the overall variation differs from the within variation because the process is not stable. It uses the Coating.jmp data table from the Quality Control folder of Sample Data (taken from the ASTM Manual on Presentation of Data and Control Chart Analysis). The process variable of interest is the Weight column, grouped into subgroups by the Sample column.
|
1.
|
|
2.
|
Select Analyze > Quality and Process > Process Capability.
|
|
3.
|
|
4.
|
Open the Process Subgrouping outline.
|
|
5.
|
|
6.
|
|
7.
|
Click Nest Subgroup ID Column.
|
|
8.
|
Click OK.
|
|
9.
|
|
10.
|
Click OK.
|
|
11.
|
Select Show Within Sigma Points from the Goal Plot red triangle menu.
|
|
12.
|
Select Individual Detail Reports from the Process Capability red triangle menu.
|
Figure 11.25 Process Capability Report for Coating.jmp Data
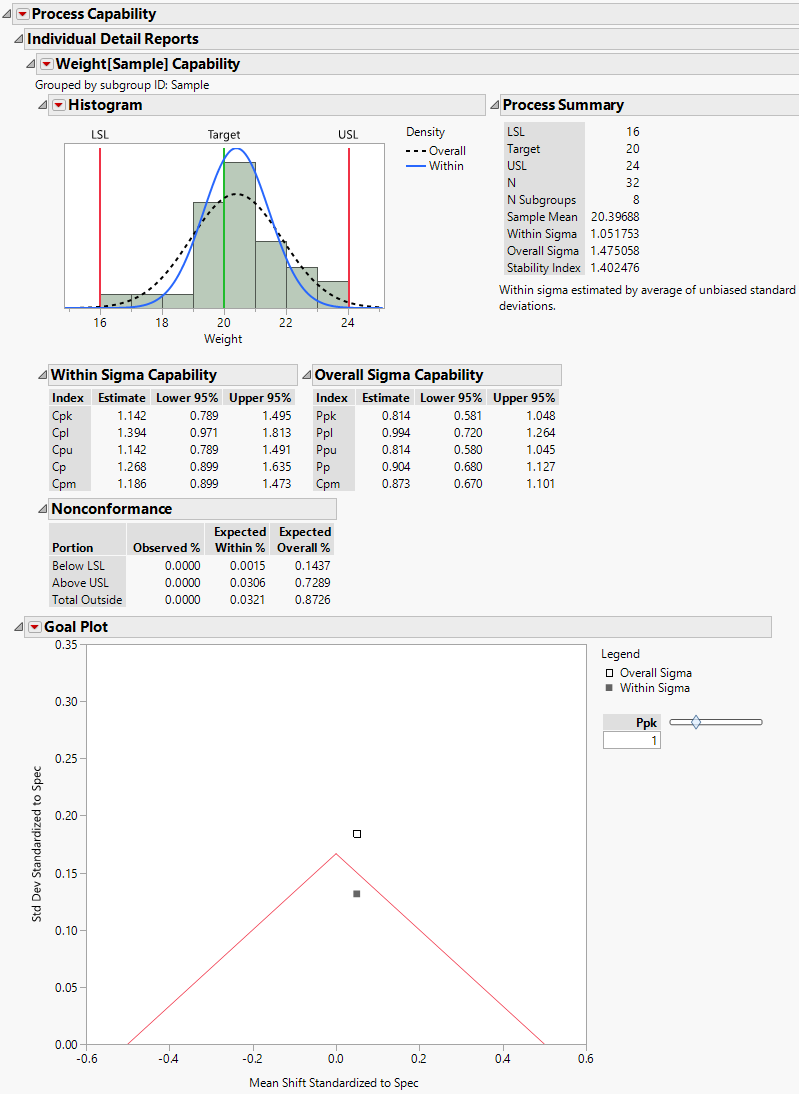
Figure 11.25 shows the resulting Process Capability report. The Goal Plot shows two points that represent the mean shift and standard deviation standardized to the specification limits. The point labeled Overall Sigma is calculated using the overall sample standard deviation. The point labeled Within Sigma is calculated using a within-subgroup estimate of the standard deviation.
The point calculated using Overall Sigma is outside the goal triangle corresponding to a Ppk of 1. This indicates that the variable Weight results in non-conforming product.
However, the point calculated using Within Sigma is inside the goal triangle. This indicates that, if the process were stable, Weight values would have a high probability of falling within the specification limits.
Use Control Chart Builder to determine whether the Weight measurements are stable.
|
1.
|
|
1.
|
Select Analyze > Quality and Process > Control Chart Builder.
|
|
2.
|
|
3.
|
Figure 11.26 XBar and R Chart for Weight
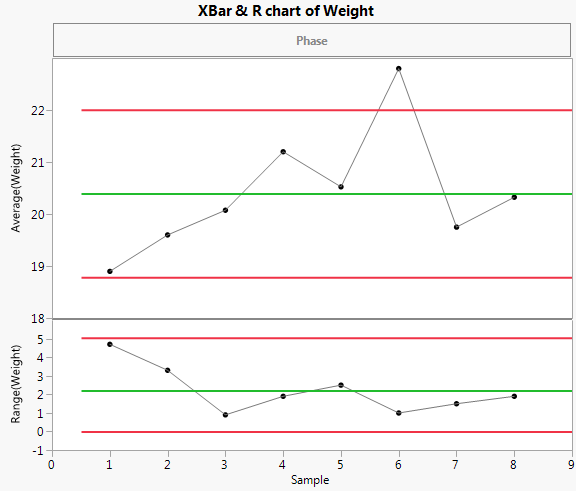
The control chart indicates that the Weight measurements are unstable. The process is affected by special causes and is unpredictable. This makes the interpretation of capability indices and nonconformance estimates highly questionable. Even estimates based on Overall Sigma are questionable, because the process is not predictable.
The histogram in Figure 11.25 shows the distribution of the Weight values with normal density curves using both sigma estimates superimposed over the histogram. The normal curve that uses the Overall Sigma estimate is flatter and wider than the normal curve that uses the Within Sigma estimate. This normal curve is more dispersed because the estimate of Overall Sigma is inflated by the special causes that make the process unstable. If the process were stable, the narrower normal curve would reflect process behavior.