Figure .13 Example of a Scatterplot Matrix
This example uses the Solubility.jmp data table, which contains data for solubility measurements for 72 different solutes.
|
1.
|
|
2.
|
|
3.
|
Figure .14 Scatterplot Matrix Window
|
4.
|
Click OK.
|
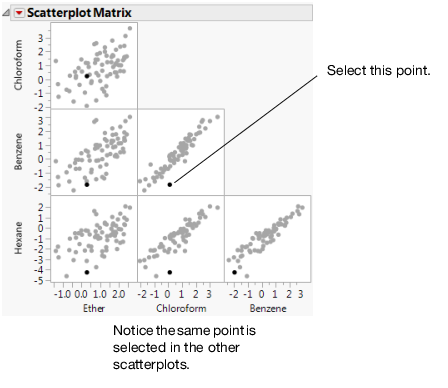
Figure .15 Scatterplot Matrix
|
•
|
The data points in the scatterplot for Benzene and Chloroform are the most tightly clustered along an imaginary line.
For example, if you select a point in the Benzene versus Chloroform scatterplot, the same point is selected in the other five plots.
Figure .16 Selected Points