
Figure .17 Example of Side-by-Side Box Plots
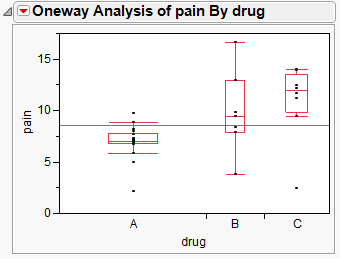
This example uses the Analgesics.jmp data table, which contains data on pain measurements taken on patients using three different drugs.
|
•
|
Does the variability in the pain control given by each drug differ? A drug with high variability would not be as reliable as a drug with low variability.
|
|
1.
|
|
2.
|
|
3.
|
|
4.
|
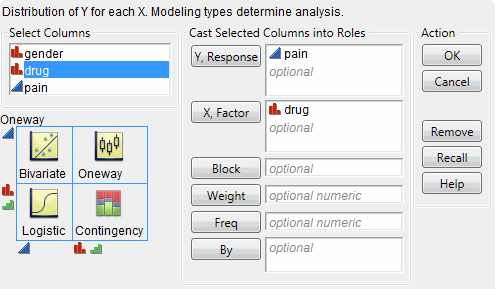
Figure .18 Fit Y by X Window
|
5.
|
Click OK.
|
|
6.
|
From the red triangle menu, select Display Options > Box Plots.
|
Figure .19 Side-by-Side Box Plots
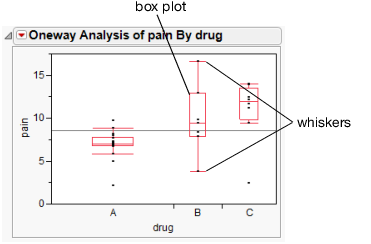
The box plots in Figure .19 show these answers: