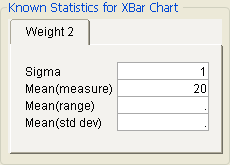
After specifying a process variable, if you click the Specify Stats (when available) button on the Control Chart Launch window, a tab with editable fields is appended to the bottom of the window. This lets you enter historical statistics (that is, statistics obtained from historical data) for the process variable. The Control Chart platform uses those entries to construct control charts. The example here shows 1 as the standard deviation of the process variable and 20 as the mean measurement.
Figure 4.7 Example of Specify Stats
If you check the Capability option on the Control Chart launch window (see Figure 4.3), a window appears as the platform is launched asking for specification limits. The standard deviation for the control chart selected is sent to the window and appears as a Specified Sigma value, which is the default option. After entering the specification limits and clicking OK, capability output appears in the same window next to the control chart. For information about how the capability indices are computed, see Capability Analysis in the Basic Analysis book.